Draw The Shear Force And Bending Moment Diagram
Muz Play
Apr 01, 2025 · 7 min read
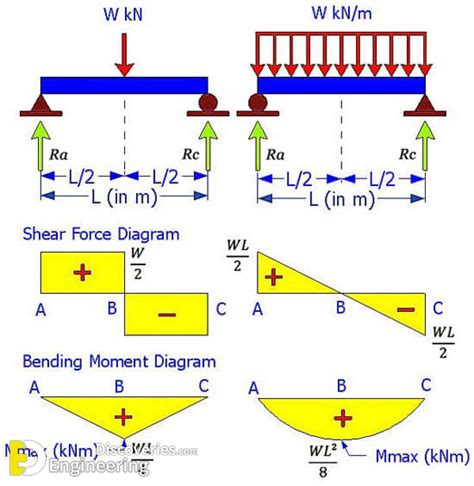
Table of Contents
Drawing Shear Force and Bending Moment Diagrams: A Comprehensive Guide
Understanding shear force and bending moment diagrams is crucial for structural engineers and anyone involved in designing and analyzing structures. These diagrams visually represent the internal forces acting within a beam or structural member under load, allowing engineers to determine the critical points of stress and design accordingly. This comprehensive guide will walk you through the process of drawing these diagrams, covering various loading conditions and techniques.
What are Shear Force and Bending Moment Diagrams?
Before diving into the drawing process, let's clarify what shear force and bending moment represent.
Shear Force
Shear force is the internal force acting parallel to the cross-section of a beam. It's the force that causes one part of the beam to slide past the other. Consider a simple beam with a load in the middle. The shear force represents the force required to keep the beam from splitting apart at any given section. It's measured in Newtons (N) or pounds (lbs).
Bending Moment
Bending moment is the internal moment that causes a beam to bend. It's the rotational force trying to bend the beam. Imagine bending a ruler – the bending moment is the force that produces the curvature. It's measured in Newton-meters (Nm) or pound-feet (lb-ft).
Steps to Draw Shear Force and Bending Moment Diagrams
Drawing these diagrams involves a systematic approach. Here's a step-by-step guide:
-
Draw the Free Body Diagram (FBD): This is the foundational step. Draw the beam clearly, showing all applied loads (concentrated loads, uniformly distributed loads, uniformly varying loads, etc.), reactions at the supports (like pin supports and roller supports), and dimensions. Accurately determining support reactions using equilibrium equations (ΣFx = 0, ΣFy = 0, ΣM = 0) is vital for accuracy.
-
Calculate Support Reactions: Use the equations of static equilibrium to calculate the vertical and horizontal reactions at the supports. This step ensures the entire structure is balanced. Neglecting this step leads to significantly incorrect results. Remember to consider the direction of reactions - they are often assumed and should be confirmed based on the calculations.
-
Determine Shear Force: Moving along the beam from left to right (or right to left, consistently), calculate the shear force at different points. The shear force at any section is the algebraic sum of the vertical forces acting to the left (or right) of that section. Remember:
- Concentrated Load: Causes a sudden change in shear force. The magnitude of the change is equal to the magnitude of the concentrated load.
- Uniformly Distributed Load (UDL): Causes a linear change in shear force. The slope of the shear force diagram is equal to the magnitude of the UDL.
- Uniformly Varying Load (UVL): Causes a parabolic change in shear force. The rate of change in the slope of the shear force diagram is related to the magnitude of the UVL.
-
Plot the Shear Force Diagram: Based on the calculations in step 3, plot the shear force values against their corresponding positions along the beam's length. Connect the points to create the shear force diagram. Note that the area under the UDL in the shear force diagram represents the change in shear force due to that load.
-
Determine Bending Moment: Similar to the shear force calculation, move along the beam. At any given section, the bending moment is the algebraic sum of the moments about that section. Important considerations include:
- Concentrated Load: Causes a linear change in the bending moment. The slope of the bending moment diagram is equal to the shear force at that point. A significant change occurs immediately at the concentrated load's location.
- UDL: Causes a parabolic change in the bending moment. The curvature of the bending moment diagram is related to the UDL.
- UVL: Causes a cubic change in the bending moment. The rate of change in the curvature of the bending moment diagram is related to the UVL.
-
Plot the Bending Moment Diagram: Plot the bending moment values against their corresponding positions, creating the bending moment diagram. The area under the shear force diagram represents the change in bending moment.
-
Identify Critical Points: The diagrams will reveal points of maximum shear force and maximum bending moment. These are the critical points for structural design. These values are directly related to the stress in the beam and must be considered for appropriate selection of materials and dimensions.
Example: Simply Supported Beam with a Central Point Load
Let's illustrate with a simple example: a simply supported beam of length L with a central point load P.
-
FBD: Draw a horizontal beam of length L, with a pin support at the left end (A) and a roller support at the right end (B). Place a downward concentrated load P at the midpoint.
-
Support Reactions: Using equilibrium equations, the vertical reactions at both A and B are P/2 each.
-
Shear Force:
- From A to the midpoint: Shear force is +P/2 (positive upwards).
- At the midpoint: Shear force jumps down by P, becoming -P/2.
- From the midpoint to B: Shear force remains -P/2.
-
Bending Moment:
- At A: Bending moment is 0.
- At the midpoint: Bending moment is PL/4 (positive as the beam is sagging downwards).
- At B: Bending moment is 0.
-
Diagrams: The shear force diagram is a rectangle, with a jump at the midpoint. The bending moment diagram is a triangle, with a maximum value at the midpoint.
Different Loading Conditions and Support Types
The steps remain the same, but the diagrams' shapes vary depending on the loading and support conditions. Here are some examples:
-
Cantilever Beam: A cantilever beam is fixed at one end and free at the other. The shear force diagram is linear for a UDL and the bending moment diagram is parabolic for a UDL. A concentrated load at the free end results in a linear shear force diagram and a linear bending moment diagram. Note the fixed support condition provides both vertical and moment reactions.
-
Overhanging Beam: An overhanging beam extends beyond its supports. These introduce additional complexities in the diagrams but the same fundamental process can be applied. The process of determining the support reactions remains crucial. Overhanging sections might experience both positive and negative bending moments.
-
Multiple Concentrated Loads: The diagrams will show step changes in shear force corresponding to each concentrated load. The magnitude of the change corresponds to the load's magnitude. The bending moment will have a corresponding linear change based on the accumulated vertical forces.
-
Combination of Loads: The principles are combined. The shear force diagram will be a combination of steps and sloping lines, and the bending moment diagram will exhibit a combination of linear and curved sections.
Advanced Techniques and Considerations
-
Influence Lines: Influence lines are useful for determining the maximum shear force and bending moment at a specific location under various moving loads. They visually show the influence of a moving load on the internal forces.
-
Software Tools: Software like SAP2000, ETABS, and RISA-3D can automatically generate these diagrams. However, understanding the underlying principles remains essential for interpreting results and making sound engineering judgments.
-
Sign Conventions: Maintaining consistent sign conventions (e.g., positive shear force upwards, positive bending moment causing sagging) throughout the calculations is crucial for accurate results.
-
Accuracy: Precise calculations are essential. Even slight errors in the support reactions can lead to significant inaccuracies in the diagrams. Double-checking calculations and considering the units is vital.
Conclusion
Drawing shear force and bending moment diagrams is a fundamental skill in structural engineering. Mastering this skill is critical for accurate structural analysis and design. While software tools can assist, a solid grasp of the underlying principles and step-by-step methodology remains essential. Remember to meticulously consider support conditions, loading types, and sign conventions to create accurate and reliable diagrams. By diligently following the steps outlined in this guide, you can confidently tackle a wide range of beam analysis problems. This understanding provides a foundation for more advanced structural analyses.
Latest Posts
Latest Posts
-
Pick A Number Between 1 And 51
Apr 02, 2025
-
Do Protists Have Membrane Bound Organelles
Apr 02, 2025
-
Naming Ionic Compounds With Transition Metals
Apr 02, 2025
-
The Subunits Of A Triglyceride Are
Apr 02, 2025
-
Write An Equation Of The Line In Standard Form
Apr 02, 2025
Related Post
Thank you for visiting our website which covers about Draw The Shear Force And Bending Moment Diagram . We hope the information provided has been useful to you. Feel free to contact us if you have any questions or need further assistance. See you next time and don't miss to bookmark.
