How To Calculate The Expected Frequency
Muz Play
Mar 26, 2025 · 6 min read
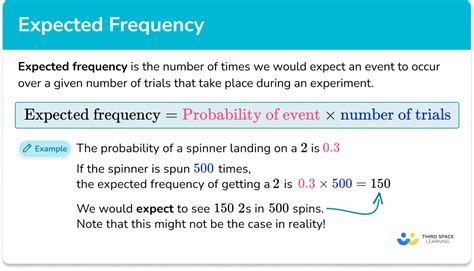
Table of Contents
How to Calculate Expected Frequency: A Comprehensive Guide
Expected frequency, a cornerstone of statistical analysis, represents the anticipated number of occurrences of an event given specific conditions. Understanding how to calculate expected frequency is crucial in various fields, from hypothesis testing and chi-square tests to probability modeling and forecasting. This comprehensive guide will delve into the intricacies of calculating expected frequency, exploring different scenarios and providing practical examples.
What is Expected Frequency?
Expected frequency, often denoted as E, contrasts with observed frequency (O), which is the actual number of times an event occurred in a real-world experiment or observation. While observed frequency reflects reality, expected frequency is a theoretical prediction based on probability or a model. The difference between observed and expected frequencies is critical in determining if a deviation from expectations is statistically significant or merely due to random chance.
Calculating Expected Frequency: Different Scenarios
The method for calculating expected frequency varies depending on the context. Let's explore several key scenarios:
1. Simple Probability and Expected Frequency
This is the most straightforward case. Imagine a fair six-sided die. The probability of rolling any specific number (1, 2, 3, 4, 5, or 6) is 1/6. If you roll the die 60 times, the expected frequency for each number is:
Expected Frequency = Probability × Number of Trials
Expected Frequency = (1/6) × 60 = 10
Therefore, you'd expect each number to appear approximately 10 times. This is an idealized scenario; in reality, you might observe some variation due to randomness.
2. Expected Frequency in Contingency Tables
Contingency tables are used to analyze the relationship between two or more categorical variables. Calculating expected frequencies in contingency tables involves a slightly more complex process. Let's consider a 2x2 table:
| Group A | Group B | Total | |
|---|---|---|---|
| Category X | a | b | a+b |
| Category Y | c | d | c+d |
| Total | a+c | b+d | N |
Where:
- 'a', 'b', 'c', and 'd' are the observed frequencies.
- N is the total number of observations.
The expected frequency for each cell is calculated using the following formula:
Expected Frequency (Cell ij) = (Row Total i × Column Total j) / Grand Total N
For example, the expected frequency for cell 'a' (Category X and Group A) would be:
Expected Frequency (a) = ((a+b) × (a+c)) / N
Similarly, you would calculate the expected frequencies for cells 'b', 'c', and 'd'.
3. Expected Frequency in Binomial Distribution
The binomial distribution models the probability of a certain number of successes in a fixed number of independent Bernoulli trials (trials with only two outcomes, success or failure). The expected frequency for a specific number of successes (k) in n trials with a success probability p is:
Expected Frequency (k successes) = n × (nCk) × p<sup>k</sup> × (1-p)<sup>(n-k)</sup>
Where:
- nCk is the binomial coefficient, representing the number of ways to choose k successes from n trials (n! / (k! × (n-k)!))
4. Expected Frequency in Poisson Distribution
The Poisson distribution models the probability of a given number of events occurring in a fixed interval of time or space, given a known average rate (λ). The expected frequency for k events is:
Expected Frequency (k events) = (e<sup>-λ</sup> × λ<sup>k</sup>) / k!
Where:
- e is the base of the natural logarithm (approximately 2.71828)
- k! is the factorial of k
5. Expected Frequency and Hypothesis Testing
Expected frequencies play a crucial role in various hypothesis tests, most notably the chi-square test. This test compares observed and expected frequencies to assess whether there's a statistically significant difference between them. A large difference suggests that the observed data is unlikely to have arisen from the expected distribution under the null hypothesis, leading to the rejection of the null hypothesis.
Practical Examples
Let's illustrate these calculations with some practical examples:
Example 1: Coin Toss
Suppose you toss a fair coin 100 times. What's the expected frequency of heads?
Probability of heads = 0.5 Number of trials = 100
Expected Frequency (Heads) = 0.5 × 100 = 50
Example 2: Contingency Table
Let's consider a study investigating the relationship between smoking and lung cancer:
| Lung Cancer | No Lung Cancer | Total | |
|---|---|---|---|
| Smoker | 80 | 20 | 100 |
| Non-smoker | 20 | 80 | 100 |
| Total | 100 | 100 | 200 |
To calculate the expected frequency for smokers with lung cancer:
Expected Frequency = (100 × 100) / 200 = 50
This means we would expect 50 smokers to have lung cancer if there were no relationship between smoking and lung cancer. The fact that we observed 80 suggests a potential association.
Example 3: Binomial Distribution
A manufacturing process produces 10% defective items. If you randomly sample 20 items, what is the expected frequency of finding exactly 2 defective items?
n = 20 k = 2 p = 0.1
Expected Frequency = 20 × (20C2) × 0.1<sup>2</sup> × 0.9<sup>18</sup> ≈ 1.216
Interpreting Expected Frequencies
It's essential to understand that expected frequencies are theoretical values. They represent what you'd expect to observe on average if your model or assumptions are correct. Differences between observed and expected frequencies are expected due to random variation. Statistical tests help determine if these differences are significant enough to warrant rejecting your underlying assumptions.
Common Mistakes and Pitfalls
- Confusing observed and expected frequencies: Clearly distinguish between what you actually observed and what your model predicts.
- Incorrectly calculating expected frequencies: Double-check your calculations, especially in complex scenarios like contingency tables.
- Ignoring the limitations of expected frequencies: Remember that expected frequencies are theoretical values and may not perfectly reflect reality.
- Misinterpreting statistical significance: Don't automatically conclude causality just because there's a statistically significant difference between observed and expected frequencies. Correlation does not equal causation.
Conclusion
Calculating expected frequency is a fundamental skill in statistics. Understanding how to calculate and interpret expected frequencies is crucial for conducting meaningful analyses and drawing valid conclusions from data. Mastering these concepts will significantly enhance your ability to work with statistical data across diverse fields. This guide has provided a comprehensive overview, covering various scenarios and practical examples. By carefully applying the appropriate formulas and understanding the limitations of expected frequencies, you can gain valuable insights from your data. Remember that consistent practice and a thorough understanding of statistical principles are essential for accurate and effective application.
Latest Posts
Latest Posts
-
Integration And Differentiation Of Power Series
Mar 26, 2025
-
What Is A Life History Trait
Mar 26, 2025
-
Difference Between An Open System And A Closed System
Mar 26, 2025
-
One To One Function And Inverse Function
Mar 26, 2025
-
What Can Help To Determine The Age Of A Fossil
Mar 26, 2025
Related Post
Thank you for visiting our website which covers about How To Calculate The Expected Frequency . We hope the information provided has been useful to you. Feel free to contact us if you have any questions or need further assistance. See you next time and don't miss to bookmark.
