How To Find Equilibrium Quantity From A Table
Muz Play
Apr 07, 2025 · 6 min read
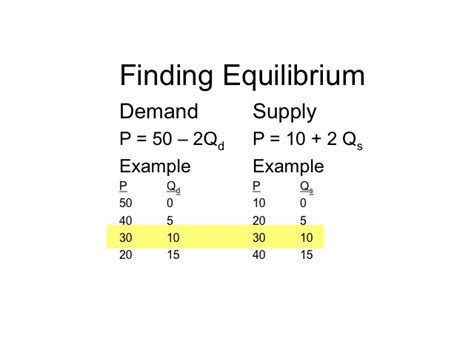
Table of Contents
How to Find Equilibrium Quantity from a Table: A Comprehensive Guide
Finding the equilibrium quantity from a supply and demand table is a fundamental concept in economics. It represents the point where the market clears—where the quantity demanded by consumers precisely matches the quantity supplied by producers. Understanding how to locate this point is crucial for anyone studying economics, business, or related fields. This comprehensive guide will walk you through the process step-by-step, providing clear explanations and practical examples.
Understanding Supply and Demand
Before diving into finding the equilibrium quantity, let's briefly review the concepts of supply and demand.
Demand
Demand reflects the consumer's desire and ability to purchase a good or service at various price points. A demand schedule, often presented as a table, illustrates this relationship. As price decreases, the quantity demanded generally increases (assuming all other factors remain constant, ceteris paribus). This inverse relationship is a core tenet of economic theory.
Supply
Supply, on the other hand, represents the producer's willingness and ability to offer a good or service at different prices. A supply schedule shows this relationship. As price increases, the quantity supplied generally increases, reflecting producers' incentive to provide more at higher prices.
The Interaction of Supply and Demand
The interplay of supply and demand determines market equilibrium. Equilibrium is the point where the forces of supply and demand are balanced, resulting in a stable market price and quantity.
Identifying Equilibrium Quantity from a Table: A Step-by-Step Approach
Let's illustrate the process with an example. Consider the following supply and demand schedule for apples:
| Price (USD/kg) | Quantity Demanded (kg) | Quantity Supplied (kg) |
|---|---|---|
| 1 | 1000 | 200 |
| 2 | 800 | 400 |
| 3 | 600 | 600 |
| 4 | 400 | 800 |
| 5 | 200 | 1000 |
Step 1: Examine the Table
Carefully review the supply and demand data presented in the table. Note the columns representing price, quantity demanded, and quantity supplied. Understanding these components is crucial for the next steps.
Step 2: Locate the Point of Equality
The equilibrium point is where the quantity demanded equals the quantity supplied. Scan the table to find the price at which these quantities intersect. In our apple example, this occurs at a price of $3 per kilogram.
Step 3: Identify the Equilibrium Quantity
Once you've found the equilibrium price, determine the corresponding quantity. At a price of $3, both the quantity demanded and the quantity supplied are 600 kg. Therefore, the equilibrium quantity is 600 kg.
Step 4: Graphical Representation (Optional but Helpful)
While the table provides the numerical data, visually representing this information with a graph can enhance understanding. Plot the price on the vertical axis and quantity on the horizontal axis. Plot the supply and demand points individually, then connect them to create the supply and demand curves. The point where the two curves intersect represents the equilibrium point, visually confirming the equilibrium price and quantity determined from the table.
Dealing with More Complex Scenarios
While the example above presents a straightforward scenario, real-world supply and demand tables might be more complex. Let's consider some variations:
Scenario 1: No Exact Match
Sometimes, the table doesn't provide an exact match where quantity demanded precisely equals quantity supplied. In such cases, you need to identify the price range where the equilibrium lies. For example:
| Price (USD/kg) | Quantity Demanded (kg) | Quantity Supplied (kg) |
|---|---|---|
| 1 | 1000 | 200 |
| 2 | 800 | 450 |
| 3 | 600 | 700 |
| 4 | 400 | 950 |
Here, there's no exact match. The equilibrium price lies between $2 and $3. To approximate the equilibrium quantity, you could use interpolation or linear extrapolation techniques, though these are beyond the scope of basic table analysis.
Scenario 2: Multiple Equilibrium Points
In rare cases, due to unusual supply and demand curve shapes, multiple equilibrium points might theoretically exist. However, these situations are less common in real-world markets. In these unusual cases, a graphical representation is often necessary to fully analyze the situation.
Scenario 3: Understanding Shifts in Supply and Demand
A critical aspect of understanding equilibrium is how it responds to shifts in supply and demand. Changes in factors like consumer income, input prices, technology, government policies (taxes, subsidies), and consumer preferences can cause these shifts. Analyzing these shifts requires comparing multiple supply and demand schedules. For example, compare two tables, one before and one after a specific market event, to understand the shift in the equilibrium quantity.
Applications and Importance of Equilibrium Quantity
Understanding how to find the equilibrium quantity from a table is vital in many contexts:
-
Market Analysis: Businesses use this knowledge to predict market conditions, optimize production, and make informed pricing decisions.
-
Government Policy: Policymakers use supply and demand analysis to assess the impact of taxes, subsidies, price controls, and other interventions on market outcomes.
-
Economic Forecasting: Economists use equilibrium analysis to predict future market trends and anticipate potential shortages or surpluses.
-
Resource Allocation: Efficient resource allocation relies heavily on understanding market equilibrium to direct resources where they are most valued.
-
Investment Decisions: Investors often base their decisions on market equilibrium and forecasts of future prices and quantities.
Beyond the Table: Advanced Techniques
While this guide focuses on extracting equilibrium quantity from a table, it's important to note that more sophisticated techniques exist for analyzing supply and demand. These include:
-
Regression Analysis: Statistical techniques can be used to estimate supply and demand functions from datasets, providing more precise estimates of equilibrium.
-
Econometric Modeling: Complex econometric models incorporate numerous variables to analyze markets more comprehensively.
-
Dynamic Modeling: These advanced models incorporate time-dependent changes in supply and demand, providing more accurate predictions in dynamic markets.
Conclusion
Finding the equilibrium quantity from a supply and demand table is a fundamental skill in economics and related fields. By following the step-by-step approach outlined in this guide, you can confidently identify the equilibrium point and understand its significance in analyzing market dynamics. While simple tables provide a basic understanding, remember that more sophisticated methods may be required for complex real-world scenarios. Mastering this skill provides a strong foundation for understanding market forces and making informed decisions in various economic contexts. Remember to always consider the limitations of tabular data and utilize graphical representations whenever possible for a clearer understanding. This comprehensive guide has equipped you with the tools to confidently tackle these fundamental concepts.
Latest Posts
Latest Posts
-
How Did The Element Hydrogen Get Its Name
Apr 10, 2025
-
How To Find The Period In Physics
Apr 10, 2025
-
Lipids Are Compounds That Are Soluble In
Apr 10, 2025
-
Who Are Users Of Accounting Information
Apr 10, 2025
-
Complex Zeros Of A Polynomial Function
Apr 10, 2025
Related Post
Thank you for visiting our website which covers about How To Find Equilibrium Quantity From A Table . We hope the information provided has been useful to you. Feel free to contact us if you have any questions or need further assistance. See you next time and don't miss to bookmark.