How To Find Expected Frequency In Chi Square
Muz Play
Mar 18, 2025 · 5 min read
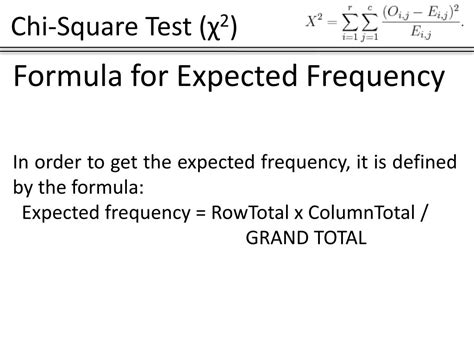
Table of Contents
How to Find Expected Frequency in Chi-Square Analysis: A Comprehensive Guide
Chi-square analysis is a powerful statistical tool used to determine if there's a significant association between two categorical variables. Understanding how to calculate the expected frequencies is crucial for accurately conducting and interpreting this test. This comprehensive guide will walk you through the process, explaining the concepts in detail and providing practical examples.
Understanding Expected Frequency in Chi-Square Tests
Before diving into the calculations, let's clarify what expected frequency means in the context of a chi-square test. The expected frequency represents the number of observations you would expect in each cell of your contingency table if there were no association between the two variables. It's a theoretical value based on the marginal totals (row and column sums) of your observed data. The difference between your observed frequencies (actual data) and these expected frequencies is what drives the chi-square statistic. A large difference suggests a strong association, while a small difference suggests a weak or no association.
Calculating Expected Frequency: A Step-by-Step Approach
The formula for calculating expected frequency (E) is:
(Row Total * Column Total) / Grand Total
Let's break this down step-by-step with a clear example:
Imagine a study investigating the relationship between gender and preference for coffee or tea. We collect the following data:
| Coffee | Tea | Total | |
|---|---|---|---|
| Male | 60 | 40 | 100 |
| Female | 30 | 70 | 100 |
| Total | 90 | 110 | 200 |
This table shows the observed frequencies. To calculate the expected frequencies, we'll use the formula for each cell:
1. Coffee Preference among Males:
- Row Total (Males): 100
- Column Total (Coffee): 90
- Grand Total: 200
Expected Frequency (E) = (100 * 90) / 200 = 45
2. Coffee Preference among Females:
- Row Total (Females): 100
- Column Total (Coffee): 90
- Grand Total: 200
Expected Frequency (E) = (100 * 90) / 200 = 45
3. Tea Preference among Males:
- Row Total (Males): 100
- Column Total (Tea): 110
- Grand Total: 200
Expected Frequency (E) = (100 * 110) / 200 = 55
4. Tea Preference among Females:
- Row Total (Females): 100
- Column Total (Tea): 110
- Grand Total: 200
Expected Frequency (E) = (100 * 110) / 200 = 55
This gives us the following table of expected frequencies:
| Coffee | Tea | Total | |
|---|---|---|---|
| Male | 45 | 55 | 100 |
| Female | 45 | 55 | 100 |
| Total | 90 | 110 | 200 |
Notice that the row and column totals for the expected frequencies are the same as the observed frequencies. This is a crucial check to ensure your calculations are correct.
Interpreting Expected Frequencies and Conducting the Chi-Square Test
Once you've calculated the expected frequencies, you can proceed with the chi-square test itself. The test compares the observed and expected frequencies to determine if the difference is statistically significant. The formula for the chi-square statistic (χ²) is:
χ² = Σ [(O - E)² / E]
Where:
- O = Observed frequency
- E = Expected frequency
- Σ = Summation across all cells
Applying this to our example:
χ² = [(60-45)²/45] + [(40-55)²/55] + [(30-45)²/45] + [(70-55)²/55] ≈ 18.18
The calculated chi-square value is then compared to a critical value from the chi-square distribution table. This table uses degrees of freedom (df), calculated as:
(Number of rows - 1) * (Number of columns - 1)
In our example, df = (2-1) * (2-1) = 1. If the calculated chi-square value exceeds the critical value at your chosen significance level (e.g., 0.05), you reject the null hypothesis (that there is no association between gender and coffee/tea preference).
Important Considerations and Potential Pitfalls
- Assumptions: Chi-square tests assume independence of observations and expected frequencies of at least 5 in each cell. If expected frequencies are too low, consider combining categories or using alternative tests like Fisher's exact test.
- Effect Size: While the chi-square test indicates significance, it doesn't measure the strength of the association. Measures like Cramer's V or phi coefficient can quantify this.
- Software: Statistical software packages (like R, SPSS, or Python with SciPy) can easily perform chi-square tests, including calculating expected frequencies. Using software is strongly recommended for larger datasets.
- Data Quality: Accurate and reliable data is paramount for a valid chi-square analysis. Errors in data collection can significantly impact results.
- Understanding the Null Hypothesis: Remember, the chi-square test assesses the probability of observing your data if the null hypothesis (no association) is true. Rejecting the null hypothesis doesn't prove a causal relationship; it simply suggests an association warrants further investigation.
Advanced Applications and Extensions
The basic chi-square test can be extended in several ways:
- Goodness-of-fit test: This variation tests if a sample distribution fits a theoretical distribution (e.g., testing if your data follows a normal distribution).
- Test of homogeneity: This examines whether several populations have the same distribution of a categorical variable.
- McNemar's test: A specific type of chi-square test used for paired nominal data (e.g., before-and-after measurements).
Conclusion: Mastering Expected Frequency for Powerful Analysis
Calculating expected frequencies is a fundamental step in conducting a chi-square test. Understanding this process enables you to perform this important statistical test correctly and interpret the results accurately. By meticulously following the steps outlined in this guide and paying attention to the caveats, you can leverage the power of chi-square analysis to explore relationships within your data and draw meaningful conclusions. Remember to always consider the limitations of the test and consider the use of statistical software for efficient and accurate calculations, especially when dealing with larger datasets. The use of appropriate statistical software will also help ensure the reliability of your results and strengthen the validity of your conclusions. Always remember that statistical significance doesn't automatically equate to practical significance; consider the context of your research when interpreting your findings.
Latest Posts
Latest Posts
-
Work Done By An Electric Field
Mar 18, 2025
-
How Much Energy To Be At Zero Kinetic Energy
Mar 18, 2025
-
Current As A Function Of Time
Mar 18, 2025
-
Ode To Billy Joe Lyrics Meaning
Mar 18, 2025
-
Where Does The Light Independent Reaction Take Place
Mar 18, 2025
Related Post
Thank you for visiting our website which covers about How To Find Expected Frequency In Chi Square . We hope the information provided has been useful to you. Feel free to contact us if you have any questions or need further assistance. See you next time and don't miss to bookmark.
