How To Read A Gc Chromatogram
Muz Play
Mar 27, 2025 · 6 min read
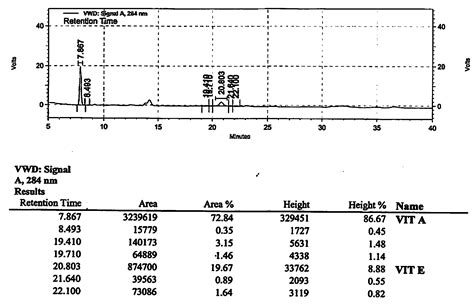
Table of Contents
How to Read a GC Chromatogram: A Comprehensive Guide
Gas chromatography (GC) is a powerful analytical technique used to separate and analyze volatile compounds in a sample. The result of a GC analysis is a chromatogram, a visual representation of the separated components. Learning to interpret a GC chromatogram is crucial for anyone working in analytical chemistry, environmental science, or related fields. This comprehensive guide will walk you through the essential aspects of understanding and interpreting GC chromatograms, from identifying peaks to calculating retention times and understanding peak area.
Understanding the Basics of a GC Chromatogram
A GC chromatogram is a plot of detector response (usually represented as peak height or area) versus retention time. The retention time is the time it takes for a specific compound to travel through the GC column and reach the detector. Each peak on the chromatogram represents a different component in the sample mixture. The area under each peak is directly proportional to the concentration of the corresponding compound.
Key Features of a GC Chromatogram:
-
X-axis (Retention Time): This axis represents the time elapsed since the injection of the sample. It's measured in minutes. Different compounds will have different retention times based on their interaction with the stationary phase of the GC column.
-
Y-axis (Detector Response): This axis represents the signal from the detector. The higher the peak, the greater the concentration of the corresponding compound in the sample. Common detector responses include peak height and peak area. Peak area is generally preferred for quantitative analysis because it is less sensitive to variations in injection volume.
-
Peaks: Each peak represents a single component (or a group of very similar components) in the sample. The number of peaks indicates the number of distinct compounds present.
-
Baseline: The baseline is the horizontal line representing the detector signal in the absence of any analyte. It's essential to distinguish peaks from baseline noise for accurate analysis.
-
Peak Width: The width of a peak at its base is related to the efficiency of the separation. Narrower peaks indicate better separation.
-
Retention Time (Rt): This is the time it takes for a compound to travel through the column and reach the detector. It's a characteristic property of a compound under specific GC conditions (column type, temperature program, carrier gas flow rate).
Interpreting the Peaks: Qualitative Analysis
Qualitative analysis using GC focuses on identifying the components present in the sample. This is primarily done by comparing the retention times of the peaks in the sample chromatogram to the retention times of known standards run under identical conditions.
Matching Retention Times:
-
Standard Solutions: To identify the components, you need to run a standard solution containing known compounds. This provides retention times for each known component under the same conditions as the unknown sample.
-
Retention Time Matching: If a peak in the unknown sample has a retention time matching a peak in the standard, this strongly suggests the presence of that specific compound in the sample.
-
Limitations: Retention time matching is not always definitive. Isomers, compounds with similar structures, can have very similar retention times.
Using Retention Indices:
Retention indices offer a more reliable approach to identification. These indices are calculated based on the retention times of alkanes run under the same conditions. The retention index is a standardized value that is less sensitive to changes in operating conditions compared to raw retention times. Matching retention indices from your sample to a library of known compounds improves the certainty of identification.
Quantifying Components: Quantitative Analysis
Quantitative analysis using GC focuses on determining the amount of each component present in the sample. This is typically done by measuring the area under each peak and relating it to the concentration.
Peak Area Measurement:
The area under each peak is proportional to the amount of analyte present. GC software typically integrates the peaks automatically, providing peak area values. Different integration methods exist, and choosing the appropriate method is crucial for accurate quantitation.
Calibration Curves:
To relate peak area to concentration, a calibration curve is usually constructed. This involves running a series of standard solutions with known concentrations and plotting the peak area against the concentration. The resulting curve is used to determine the concentration of the unknown components in the sample based on their peak areas.
-
Internal Standard Method: An internal standard, a known compound added to both the standard solutions and the unknown sample, helps to correct for variations in injection volume and other factors.
-
External Standard Method: This simpler method uses standard solutions only. This is less accurate because it is more susceptible to variations in injection volume.
Dealing with Common Chromatographic Issues
Even with careful technique, certain challenges may arise during GC analysis.
Peak Overlap:
If peaks are too close together, they may overlap, making accurate integration and quantitation difficult. This can be addressed by optimizing the GC conditions (e.g., changing the column, adjusting the temperature program).
Tailing Peaks:
Tailing peaks are asymmetric, with a long tail on one side. This often indicates interactions between the analyte and the active sites on the column or injector. Addressing the cause of tailing might involve changing the column or using a different injection technique.
Fronting Peaks:
Fronting peaks have a sharper rise and a long tail on the other side. These are less common than tailing peaks, but can still impact quantitative accuracy.
Ghost Peaks:
Ghost peaks are peaks that appear in the chromatogram even in the absence of the sample. They are generally caused by contamination of the GC system. Regular cleaning and maintenance are essential to minimize ghost peaks.
Baseline Noise:
Baseline noise is random fluctuations in the detector signal, making it difficult to identify small peaks. This can often be reduced by improving the cleanliness of the GC system, optimizing the detector settings, and filtering the data.
Advanced Techniques and Considerations
This section covers some more advanced topics in GC and chromatogram interpretation.
Method Validation:
Before using a GC method for quantitative analysis, it's important to validate it. This involves assessing the accuracy, precision, linearity, and limits of detection and quantification.
Two-Dimensional Gas Chromatography (GCxGC):
This advanced technique uses two columns in series, resulting in improved separation of complex mixtures. The resulting chromatogram is more complex to interpret but provides significantly higher resolution.
Data Processing Software:
Sophisticated software packages are widely available for processing GC data. These programs automate peak integration, identification, and quantification. They often include libraries of known compounds to aid in peak identification.
Conclusion: Mastering GC Chromatogram Interpretation
Understanding and interpreting GC chromatograms is a fundamental skill for anyone working with this powerful analytical technique. While this guide provides a comprehensive overview, practice and experience are crucial for developing proficiency. By carefully considering the key features of the chromatogram, understanding peak characteristics, and employing appropriate quantitative methods, you can successfully extract valuable information from your GC data. Remember that consistency in sample preparation, instrument operation, and data analysis are paramount for accurate and reliable results. Continued learning and engagement with advanced techniques will further enhance your ability to effectively leverage gas chromatography in your analytical work.
Latest Posts
Latest Posts
-
Differentiate Between Isometric And Isotonic Contractions
Mar 30, 2025
-
Match Each Equation With A Graph Above
Mar 30, 2025
-
How Do Organisms Generate Energy When Oxygen Is Not Available
Mar 30, 2025
-
What Does Lda Do In A Reaction
Mar 30, 2025
-
What Is Found In Animal Cells But Not Plant
Mar 30, 2025
Related Post
Thank you for visiting our website which covers about How To Read A Gc Chromatogram . We hope the information provided has been useful to you. Feel free to contact us if you have any questions or need further assistance. See you next time and don't miss to bookmark.
