What Is P Bar In Statistics
Muz Play
Apr 06, 2025 · 6 min read
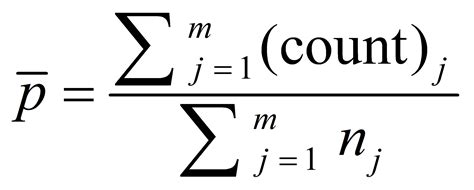
Table of Contents
What is a P-Bar in Statistics? A Comprehensive Guide
The p-bar, often denoted as $\bar{p}$, is a crucial statistic used in statistical process control (SPC) and hypothesis testing. It represents the average of sample proportions from multiple samples drawn from a larger population. Understanding the p-bar is essential for assessing the stability and consistency of a process, making informed decisions about process improvement, and determining if a process is in a state of statistical control. This comprehensive guide will delve into the intricacies of the p-bar, exploring its calculation, interpretation, and practical applications.
Understanding Sample Proportions and the P-Bar
Before diving into the p-bar, let's clarify the concept of a sample proportion. In statistical terms, a sample proportion (p) is the fraction of successes (or occurrences of a specific characteristic) within a sample. For example, if you randomly select 100 items from a production line and find 10 to be defective, your sample proportion (p) would be 10/100 = 0.1 or 10%.
Now, imagine you take multiple samples from the same population. Each sample will yield its own sample proportion. The p-bar ($\bar{p}$) is simply the average of these sample proportions. It provides a more robust estimate of the overall population proportion than a single sample proportion, as it leverages data from multiple samples to reduce the impact of sampling variability.
Calculating the P-Bar: A Step-by-Step Guide
The calculation of the p-bar is straightforward:
-
Collect Multiple Samples: Begin by obtaining k random samples from the population. The number of samples (k) should be sufficiently large to ensure reliable results. The size of each sample (n) might vary but is often kept consistent for ease of analysis.
-
Calculate Sample Proportions (p): For each of the k samples, determine the sample proportion (p<sub>i</sub>), where i represents the sample number (i = 1, 2, ..., k).
-
Sum the Sample Proportions: Add up all the individual sample proportions: Σp<sub>i</sub> = p<sub>1</sub> + p<sub>2</sub> + ... + p<sub>k</sub>
-
Calculate the P-Bar: Divide the sum of the sample proportions by the total number of samples (k):
$\bar{p} = \frac{\sum_{i=1}^{k} p_i}{k}$
Example: Let's say we take 5 samples of size 50 each from a production line. The number of defective items in each sample are: 2, 5, 3, 1, 4.
-
Sample proportions (p<sub>i</sub>): 2/50 = 0.04, 5/50 = 0.10, 3/50 = 0.06, 1/50 = 0.02, 4/50 = 0.08
-
Sum of sample proportions: 0.04 + 0.10 + 0.06 + 0.02 + 0.08 = 0.30
-
P-bar: 0.30 / 5 = 0.06
Therefore, the p-bar is 0.06 or 6%. This suggests that, on average, 6% of items in the population are defective, based on our five samples.
Interpreting the P-Bar: What Does it Tell Us?
The p-bar provides valuable insights into the underlying process:
-
Estimate of Population Proportion: The primary function of the p-bar is to estimate the true proportion of successes (or events of interest) in the overall population. This estimate is more reliable than relying on a single sample proportion.
-
Process Stability: Monitoring the p-bar over time helps assess the stability of a process. Consistent p-bar values indicate a stable process, whereas significant fluctuations suggest variability and potential problems.
-
Control Charts: P-bar charts are essential tools in SPC. These charts plot the p-bar values over time, along with control limits (upper and lower control limits). Points outside these limits indicate potential process shifts or special causes of variation requiring investigation.
-
Hypothesis Testing: The p-bar is a vital component in hypothesis testing concerning proportions. It's used to test whether there's a statistically significant difference between the observed proportion and a hypothesized value.
P-Bar vs. Other Statistical Measures
It's important to distinguish the p-bar from other related statistics:
-
Sample Proportion (p): This represents the proportion of successes within a single sample. The p-bar is the average of multiple sample proportions.
-
Population Proportion (π): This is the true proportion of successes in the entire population. The p-bar is an estimate of the population proportion.
-
X-bar: This represents the average of sample means in statistical process control, used for continuous data rather than proportions.
-
R-bar and S-bar: These are used to measure the variability within and between samples in X-bar charts. P-bar charts use different methods to measure the variability of proportions.
Applications of the P-Bar: Real-World Examples
The p-bar finds widespread applications across diverse fields:
-
Manufacturing: Monitoring the proportion of defective products on an assembly line, ensuring quality control.
-
Quality Control: Assessing the consistency of a product's characteristics, like the percentage of conforming items.
-
Healthcare: Evaluating the prevalence of a disease in a population based on multiple samples.
-
Market Research: Analyzing the percentage of consumers preferring a particular product or brand.
-
Environmental Science: Studying the proportion of contaminated samples in an area to assess environmental impact.
-
Opinion Polls: Estimating the percentage of voters who support a particular candidate, utilizing multiple surveys.
Assumptions and Limitations of Using the P-Bar
While the p-bar is a powerful tool, it relies on certain assumptions and has limitations:
-
Random Sampling: The samples should be randomly selected to represent the population accurately. Bias in sampling can lead to inaccurate p-bar estimates.
-
Independent Samples: The samples should be independent of each other; the results of one sample should not influence the results of another.
-
Sufficient Sample Size: The sample size (n) should be large enough to ensure that the sampling distribution of the sample proportions is approximately normal. A common rule of thumb is that np and n(1-p) should be greater than 5 for each sample.
-
Stable Process (for control charts): When using p-bar charts for process control, the underlying process should be stable (in control) for the control limits to be reliable. If the process is constantly changing, the control limits will not be meaningful.
Beyond the Basics: Advanced Concepts
For more in-depth analysis, consider these advanced concepts related to the p-bar:
-
Control Limits: Calculating upper and lower control limits for p-bar charts using standard deviation and z-scores. This allows for the identification of out-of-control points, signifying potential process issues.
-
Process Capability Analysis: Assessing whether a process is capable of meeting specified quality requirements using the p-bar and its associated metrics.
-
Statistical Hypothesis Testing: Utilizing the p-bar in hypothesis testing to determine if the difference between sample proportions is statistically significant.
-
Bayesian Analysis: Applying Bayesian methods to update the p-bar estimate as new information becomes available.
Conclusion: The P-Bar as a Powerful Statistical Tool
The p-bar is a versatile and valuable statistic, providing a powerful method for estimating population proportions, monitoring process stability, and making informed decisions based on sample data. By understanding its calculation, interpretation, and applications, you can leverage the p-bar to improve quality control, enhance process efficiency, and gain valuable insights from your data. Remember to always consider the underlying assumptions and limitations to ensure accurate and reliable results. Whether in manufacturing, healthcare, or market research, the p-bar remains a cornerstone of statistical analysis for understanding proportions and controlling processes.
Latest Posts
Latest Posts
-
Are Arteries Blue Or Red In Diagrams
Apr 09, 2025
-
1 Usos De Ser Y Estar
Apr 09, 2025
-
Sambia Tribe Of Papua New Guinea
Apr 09, 2025
-
What Is The Optimal Ph For Pepsin
Apr 09, 2025
-
Microscopic Anatomy Of Skeletal Muscle Worksheet Answers
Apr 09, 2025
Related Post
Thank you for visiting our website which covers about What Is P Bar In Statistics . We hope the information provided has been useful to you. Feel free to contact us if you have any questions or need further assistance. See you next time and don't miss to bookmark.