A. The Symbol For Sample Standard Deviation Is
Muz Play
Mar 19, 2025 · 6 min read
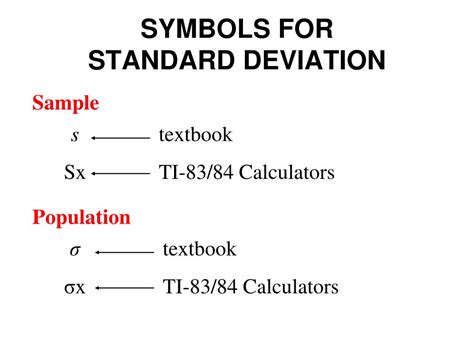
Table of Contents
The Symbol for Sample Standard Deviation: A Deep Dive into Statistical Significance
The symbol for sample standard deviation, often a source of confusion for those new to statistics, is s (lowercase 's'). Understanding this symbol and its implications is crucial for interpreting data and drawing meaningful conclusions from statistical analyses. This comprehensive guide will delve into the meaning of the sample standard deviation, its calculation, its role in statistical inference, and its relationship to the population standard deviation.
What is Sample Standard Deviation?
Before diving into the symbol, let's define what sample standard deviation actually represents. In statistics, we often work with samples—subsets of a larger population. The sample standard deviation (s) is a measure of the spread or dispersion of data points within a sample. It quantifies how much the individual data points deviate from the sample mean (average). A high sample standard deviation indicates a large spread of data, meaning the data points are widely dispersed around the mean. Conversely, a low sample standard deviation indicates a small spread, implying the data points are clustered closely around the mean.
Think of it like this: imagine you're measuring the heights of students in a class. If the sample standard deviation is high, it means the heights vary significantly; you have both very tall and very short students. If the sample standard deviation is low, the heights are relatively similar, clustering around the average height.
Why is the Sample Standard Deviation Important?
Understanding the sample standard deviation is paramount for several reasons:
-
Describing Data: It provides a concise summary of the variability within a dataset. This helps in understanding the characteristics of the sample and drawing preliminary conclusions.
-
Statistical Inference: It plays a crucial role in hypothesis testing and confidence intervals. These tools allow statisticians to make inferences about the population based on the sample data. For example, you can use the sample standard deviation to estimate the population standard deviation and construct a confidence interval around the sample mean, giving a range of values within which the true population mean is likely to lie.
-
Comparison of Groups: When comparing different groups or samples, the sample standard deviation helps in assessing whether observed differences are statistically significant or simply due to random variation.
-
Model Building: In various statistical models, such as regression analysis, the sample standard deviation is used to assess the goodness of fit and to make predictions.
Calculating Sample Standard Deviation
The formula for calculating the sample standard deviation (s) is:
s = √[ Σ(xi - x̄)² / (n - 1) ]
Where:
- s represents the sample standard deviation.
- Σ denotes the sum of.
- xi represents each individual data point in the sample.
- x̄ represents the sample mean (average).
- n represents the sample size.
- (n - 1) is the degrees of freedom, which corrects for bias when estimating the population standard deviation from a sample. Using (n-1) instead of 'n' provides a more accurate and unbiased estimate of the population standard deviation.
Let's break down the calculation step-by-step:
-
Calculate the sample mean (x̄): Sum all the data points and divide by the number of data points (n).
-
Calculate the deviations from the mean (xi - x̄): Subtract the sample mean from each individual data point.
-
Square the deviations [(xi - x̄)²]: Square each of the deviations calculated in step 2. This ensures that both positive and negative deviations contribute positively to the overall variance.
-
Sum the squared deviations [Σ(xi - x̄)²]: Add up all the squared deviations. This sum is called the sum of squares.
-
Divide by (n - 1): Divide the sum of squares by (n - 1), the degrees of freedom. This gives the sample variance.
-
Take the square root: Take the square root of the sample variance to obtain the sample standard deviation (s).
Sample Standard Deviation vs. Population Standard Deviation
It's crucial to differentiate between the sample standard deviation (s) and the population standard deviation (σ, lowercase Greek sigma). The population standard deviation (σ) represents the true spread of data in the entire population, while the sample standard deviation (s) is an estimate of the population standard deviation based on a sample drawn from that population. While both measure dispersion, they use slightly different formulas and have distinct interpretations.
The population standard deviation formula is:
σ = √[ Σ(xi - μ)² / N ]
Where:
- σ represents the population standard deviation.
- μ represents the population mean.
- N represents the population size.
The key difference lies in the denominator: the sample standard deviation uses (n - 1) to correct for bias, while the population standard deviation uses N. Because we are typically working with samples, the sample standard deviation (s) and its associated symbol are more frequently encountered in practical statistical analysis.
The Role of Sample Standard Deviation in Hypothesis Testing
The sample standard deviation plays a crucial role in hypothesis testing. It's a key component in calculating test statistics, such as the t-statistic, which is used to determine whether there's a significant difference between a sample mean and a hypothesized population mean or between the means of two independent samples.
For instance, if you're testing whether a new drug lowers blood pressure significantly compared to a placebo, you'd use the sample standard deviations of the blood pressure measurements in both the drug and placebo groups to calculate the t-statistic. The magnitude of the sample standard deviations influences the power of the statistical test; smaller standard deviations lead to more powerful tests, making it easier to detect real differences if they exist.
Understanding Degrees of Freedom
The term "degrees of freedom" (df = n-1) in the sample standard deviation formula might seem confusing at first. It refers to the number of independent pieces of information available to estimate a parameter. When calculating the sample standard deviation, you're using the sample mean to estimate the population mean. Once the sample mean is known, the last data point in the sample is not independent; it can be calculated from the other data points and the sample mean. This is why we lose one degree of freedom, resulting in the (n-1) denominator. Using (n-1) helps provide an unbiased estimate of the population variance and standard deviation.
Applications of Sample Standard Deviation Across Various Fields
The concept of sample standard deviation finds widespread application in diverse fields:
-
Finance: Assessing the risk associated with investments using measures like the standard deviation of returns.
-
Healthcare: Evaluating the variability in patient outcomes or the effectiveness of medical treatments.
-
Engineering: Assessing the precision and consistency of manufacturing processes.
-
Environmental Science: Analyzing variability in environmental data like pollution levels or species populations.
-
Social Sciences: Studying the variability in attitudes, behaviors, or opinions within a population.
Conclusion: Mastering the Symbol and its Significance
The symbol s for sample standard deviation is more than just a letter; it represents a powerful statistical tool essential for understanding data variability, making inferences about populations, and drawing reliable conclusions. By grasping the concept, calculation, and implications of sample standard deviation, you gain a deeper understanding of statistical analysis and its ability to illuminate patterns and trends within data. From simple descriptive statistics to complex hypothesis testing, the sample standard deviation and its symbol are indispensable elements in the realm of quantitative analysis. A firm understanding of this fundamental concept will enhance your ability to interpret research, draw meaningful conclusions from data, and contribute to evidence-based decision-making across various fields. The symbol itself may seem small, but the significance of the concept it represents is immense.
Latest Posts
Latest Posts
-
Find The Projection Of V Onto U
Mar 19, 2025
-
How Would A Structural Functionalist Explain Gender
Mar 19, 2025
-
Three Structural Components Of An Rna Nucleotide Monomer
Mar 19, 2025
-
The Extraordinary Science Of Addictive Junk Food
Mar 19, 2025
-
What Is The Si Unit For Kinetic Energy
Mar 19, 2025
Related Post
Thank you for visiting our website which covers about A. The Symbol For Sample Standard Deviation Is . We hope the information provided has been useful to you. Feel free to contact us if you have any questions or need further assistance. See you next time and don't miss to bookmark.
