Boiling Point On Graph In Celsius
Muz Play
Mar 15, 2025 · 5 min read
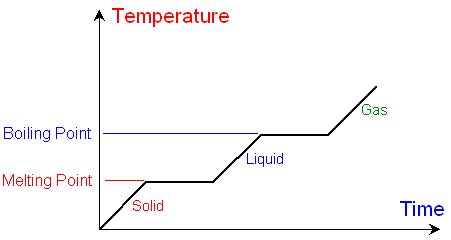
Table of Contents
Boiling Point on a Graph in Celsius: A Comprehensive Guide
Understanding boiling points is crucial in various scientific and engineering fields. Representing boiling points graphically, especially using a Celsius scale, provides a clear and concise way to visualize and analyze data. This comprehensive guide will explore the concept of boiling points, their graphical representation in Celsius, and the various applications and interpretations of such graphs.
Understanding Boiling Point
The boiling point of a liquid is the temperature at which its vapor pressure equals the external pressure surrounding the liquid. At this point, the liquid transitions to a gaseous state, forming bubbles within the liquid mass. It's important to note that the boiling point is temperature-dependent and strongly influenced by the ambient pressure. At higher altitudes, where atmospheric pressure is lower, the boiling point decreases. Conversely, at higher pressures, the boiling point increases.
Factors Affecting Boiling Point
Several factors influence a liquid's boiling point:
-
Intermolecular Forces: Stronger intermolecular forces (like hydrogen bonding, dipole-dipole interactions, and London dispersion forces) require more energy to overcome, resulting in higher boiling points. For example, water (with strong hydrogen bonding) has a much higher boiling point than methane (with only weak London dispersion forces).
-
Molecular Weight: Generally, larger molecules with higher molecular weights have higher boiling points. This is because larger molecules possess more electrons, leading to stronger London dispersion forces.
-
Molecular Shape: Branching in molecules can affect boiling points. Branched molecules have lower boiling points compared to their linear counterparts because their shape reduces the surface area for intermolecular interactions.
-
Pressure: As mentioned earlier, pressure significantly impacts the boiling point. Increasing external pressure raises the boiling point, while decreasing pressure lowers it. This is why cooking times differ at high altitudes.
Graphical Representation of Boiling Points in Celsius
Boiling points are most effectively visualized through graphs, typically using a Cartesian coordinate system. The x-axis usually represents a variable influencing the boiling point (e.g., pressure, molecular weight, or concentration), while the y-axis represents the boiling point in degrees Celsius (°C).
Types of Graphs Used:
-
Scatter Plots: These graphs are useful for showing the relationship between the boiling point and another variable. Each point on the graph represents a specific substance with its corresponding boiling point and the value of the influencing variable. For instance, a scatter plot could show the relationship between the molecular weight of a series of alkanes and their boiling points. The trendline (often a line of best fit) reveals the general relationship.
-
Line Graphs: These are particularly useful when the x-axis represents a continuous variable, such as pressure. A line graph effectively shows how the boiling point changes as pressure changes. For example, a line graph could illustrate the variation in water's boiling point at different altitudes (and thus, different atmospheric pressures).
-
Bar Graphs: These are suitable for comparing the boiling points of different substances at a constant pressure. Each bar represents a different substance, and its height corresponds to the boiling point in Celsius.
Interpreting Boiling Point Graphs
Analyzing boiling point graphs provides valuable insights into the properties and behavior of substances. Key aspects to consider include:
-
Trendlines: The trendline in a scatter plot or line graph reveals the correlation between the boiling point and the influencing variable. A positive correlation indicates that as the independent variable increases, so does the boiling point (and vice-versa for a negative correlation).
-
Outliers: Data points that significantly deviate from the trendline are called outliers. These outliers might represent substances with unique properties or experimental errors. Investigating outliers is crucial for understanding potential anomalies.
-
Extrapolation and Interpolation: Extrapolation involves estimating boiling points beyond the range of the data, while interpolation involves estimating boiling points within the data range. Both require caution, as the relationship observed within the data range might not necessarily extend beyond it.
-
Comparison: Bar graphs readily allow for direct comparison of boiling points among different substances. This comparison can reveal relative strengths of intermolecular forces and other relevant properties.
Applications of Boiling Point Graphs
Boiling point graphs have extensive applications in diverse fields:
-
Chemistry: Understanding the relationship between boiling point and molecular structure helps in identifying unknown compounds and predicting the properties of new substances.
-
Chemical Engineering: Boiling point data is crucial for designing distillation columns, reactors, and other chemical processes. Graphs help optimize process parameters for efficient separation and purification of substances.
-
Food Science: Boiling point variations with altitude affect cooking times and food safety. Understanding these variations is essential for consistent food preparation.
-
Meteorology: Boiling point data, especially concerning water, plays a role in understanding atmospheric processes and weather patterns.
-
Pharmacology: Boiling point is a relevant property in determining the stability and handling requirements of pharmaceutical compounds.
Advanced Concepts and Considerations
-
Clausius-Clapeyron Equation: This equation mathematically describes the relationship between the vapor pressure and temperature of a substance. Graphs derived from this equation can accurately predict boiling points at different pressures.
-
Phase Diagrams: These diagrams illustrate the different phases (solid, liquid, gas) of a substance at varying temperatures and pressures. The boiling point is represented by the boundary between the liquid and gas phases.
-
Superheating: Under certain conditions, a liquid can exceed its boiling point without actually boiling. This phenomenon, known as superheating, can be dangerous and requires careful consideration in industrial applications.
-
Critical Point: This is the temperature and pressure above which the distinction between liquid and gas phases disappears. Understanding the critical point is essential for designing high-pressure processes.
Conclusion
Boiling point graphs in Celsius provide a powerful tool for visualizing and analyzing data related to the boiling behavior of liquids. Understanding the factors affecting boiling points, interpreting graphical representations, and appreciating the applications of these graphs are crucial for various scientific and engineering disciplines. This guide provides a comprehensive overview of these aspects, empowering readers to effectively utilize and interpret boiling point data in their respective fields. Further exploration of the Clausius-Clapeyron equation and phase diagrams can enhance understanding and enable more precise predictions and analyses. Remember to always consider the limitations of extrapolation and interpolation and investigate any outliers thoroughly. By mastering these concepts, individuals can gain a deeper understanding of the fundamental properties of matter and their practical implications.
Latest Posts
Latest Posts
-
Basic Unit Of Structure And Function In An Organism
Mar 15, 2025
-
What Are The Rows Of A Periodic Table Called
Mar 15, 2025
-
Buffers Are A Combination Of A Weak Acid And
Mar 15, 2025
-
How To Find Frequency Of S Sine Graph
Mar 15, 2025
-
Where Does Internal Respiration Take Place
Mar 15, 2025
Related Post
Thank you for visiting our website which covers about Boiling Point On Graph In Celsius . We hope the information provided has been useful to you. Feel free to contact us if you have any questions or need further assistance. See you next time and don't miss to bookmark.
