Chi Square Test For Association Calculator
Muz Play
Mar 25, 2025 · 6 min read
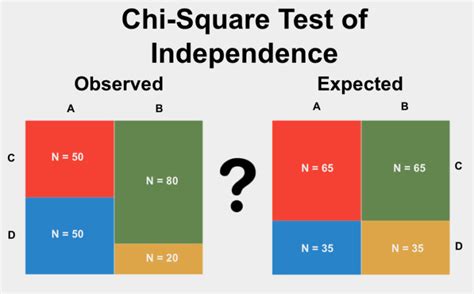
Table of Contents
- Chi Square Test For Association Calculator
- Table of Contents
- Chi-Square Test for Association Calculator: A Comprehensive Guide
- Understanding the Chi-Square Test for Association
- How to Use a Chi-Square Test for Association Calculator
- Applications of the Chi-Square Test for Association
- Limitations of the Chi-Square Test for Association
- Beyond the Basics: Interpreting the Results and Further Analysis
- Conclusion: Mastering the Chi-Square Test for Association
- Latest Posts
- Latest Posts
- Related Post
Chi-Square Test for Association Calculator: A Comprehensive Guide
The chi-square test for association, also known as the chi-square test of independence, is a statistical method used to determine if there's a significant association between two categorical variables. Understanding this test is crucial in various fields, from healthcare and social sciences to marketing and business analytics. This comprehensive guide will delve into the intricacies of the chi-square test for association, explaining its principles, applications, and limitations, while also exploring the practical use of a chi-square test for association calculator.
Understanding the Chi-Square Test for Association
The core principle behind this test is to compare the observed frequencies of data points within a contingency table (a table showing the frequency distribution of two or more categorical variables) with the expected frequencies if the variables were independent. A significant difference between observed and expected frequencies suggests a statistically significant association between the variables.
What does "Association" mean in this context? It signifies a relationship between the two categorical variables. This relationship doesn't necessarily imply causation; it simply indicates that the variables are not independent. For example, we might find an association between smoking and lung cancer, but this doesn't automatically prove that smoking causes lung cancer. Other factors could be involved.
Key Concepts:
- Contingency Table: This table organizes the data, displaying the frequencies of each combination of categories for the two variables. A typical contingency table for two variables (e.g., gender and preference for a particular product) looks like this:
| Product A | Product B | Total | |
|---|---|---|---|
| Male | 100 | 50 | 150 |
| Female | 75 | 125 | 200 |
| Total | 175 | 175 | 350 |
-
Observed Frequencies: These are the actual counts in each cell of the contingency table (the numbers within the table).
-
Expected Frequencies: These are the frequencies we'd expect to see in each cell if the two variables were independent. They're calculated using the marginal totals (row and column sums) of the contingency table. The formula is:
Expected Frequency = (Row Total * Column Total) / Grand Total. -
Chi-Square Statistic (χ²): This is the measure of the difference between observed and expected frequencies. A larger χ² value indicates a greater discrepancy, suggesting a stronger association. The formula is:
χ² = Σ [(Observed Frequency - Expected Frequency)² / Expected Frequency]. -
Degrees of Freedom (df): This reflects the number of independent pieces of information used to calculate the chi-square statistic. For a contingency table with 'r' rows and 'c' columns, the degrees of freedom are calculated as:
df = (r - 1) * (c - 1). -
P-value: This probability indicates the likelihood of observing the obtained chi-square statistic (or a more extreme value) if there were no association between the variables. A small p-value (typically less than 0.05) suggests that the association is statistically significant.
How to Use a Chi-Square Test for Association Calculator
A chi-square test for association calculator significantly simplifies the process. These calculators automate the calculations, saving time and reducing the risk of errors. While the exact interface may vary, most calculators follow a similar structure:
-
Inputting Data: You'll need to enter the observed frequencies from your contingency table into the calculator. This usually involves entering the number of observations for each cell.
-
Choosing Significance Level (α): This typically defaults to 0.05, but you can adjust it based on your specific needs. A lower alpha level makes it harder to reject the null hypothesis (no association).
-
Calculating Results: The calculator will compute the:
- Chi-square statistic (χ²)
- Degrees of freedom (df)
- P-value
-
Interpreting Results: Based on the p-value and your chosen significance level, you'll determine whether to reject the null hypothesis. If the p-value is less than your significance level, you reject the null hypothesis and conclude that there's a statistically significant association between the variables. Otherwise, you fail to reject the null hypothesis.
Applications of the Chi-Square Test for Association
The versatility of the chi-square test makes it applicable across various fields:
1. Healthcare and Medicine:
- Analyzing Treatment Efficacy: Comparing the success rates of different treatments for a disease.
- Investigating Risk Factors: Determining if certain factors (e.g., smoking, diet) are associated with the incidence of a particular disease.
- Assessing Patient Outcomes: Studying the association between patient characteristics (age, gender) and recovery rates.
2. Social Sciences:
- Examining Social Attitudes: Investigating the relationship between demographic variables (age, education) and opinions on social issues.
- Analyzing Voting Patterns: Determining if voter demographics are associated with voting preferences.
- Studying Consumer Behavior: Exploring the relationship between consumer characteristics and purchasing habits.
3. Marketing and Business:
- Analyzing Customer Segmentation: Determining if different customer segments exhibit different preferences for products or services.
- Evaluating Advertising Effectiveness: Assessing the association between advertising campaigns and sales figures.
- Market Research: Investigating the relationship between consumer demographics and brand loyalty.
4. Environmental Science:
- Assessing Pollution Levels: Determining if there's an association between pollution levels and the health of an ecosystem.
- Analyzing Species Distribution: Investigating the relationship between environmental factors (temperature, rainfall) and species abundance.
Limitations of the Chi-Square Test for Association
While powerful, the chi-square test has limitations:
-
Large Sample Size: The test can be unreliable with small sample sizes, particularly if expected frequencies in any cell are less than 5. In such cases, alternative tests might be more appropriate.
-
Categorical Data Only: The test is only suitable for analyzing categorical data. It cannot be used with continuous variables.
-
Independence of Observations: The observations must be independent; the outcome of one observation should not influence the outcome of another.
-
No Information on Strength of Association: While the test indicates the presence or absence of an association, it doesn't quantify the strength of the association. Other measures, such as Cramer's V or phi coefficient, can be used to assess the strength of association.
Beyond the Basics: Interpreting the Results and Further Analysis
A significant chi-square result merely indicates an association; it doesn't explain why the association exists. Further analysis is often necessary to explore the nature of the relationship.
Post-hoc Tests: If a significant association is found, post-hoc tests (such as residual analysis or standardized residuals) can help identify which specific cells in the contingency table contribute most to the significant chi-square value. These tests can pinpoint the particular combinations of categories driving the association.
Visualizations: Visual aids such as bar charts or mosaic plots can effectively display the data and illustrate the associations between the variables. This helps in communicating the findings more clearly than just presenting the chi-square statistic, p-value, and degrees of freedom.
Considering Effect Size: The chi-square statistic itself doesn't directly indicate the magnitude of the association. Effect size measures like Cramer's V provide a standardized measure of the strength of association, helping to understand the practical significance of the findings, regardless of sample size.
Conclusion: Mastering the Chi-Square Test for Association
The chi-square test for association is a fundamental statistical tool for analyzing the relationship between categorical variables. While the calculations can be tedious, readily available online calculators greatly simplify the process. Understanding the test's principles, interpreting its results effectively, and acknowledging its limitations are crucial for accurate and meaningful data analysis across diverse disciplines. Remember to always consider supplementing your statistical analysis with clear visualizations and possibly additional tests to further understand the relationships within your data. By using a chi-square test for association calculator and applying the knowledge presented in this comprehensive guide, you can confidently analyze your data and draw insightful conclusions.
Latest Posts
Latest Posts
-
Identify The Primary Purposes Of A Lexical Definition
Mar 28, 2025
-
Electric Field Of An Infinite Sheet
Mar 28, 2025
-
Bronsted Lowry Conjugate Acid Base Pair
Mar 28, 2025
-
Select All Structures Produced By Mosses
Mar 28, 2025
-
Discrepancies Between The Actual Self And The Ideal Self
Mar 28, 2025
Related Post
Thank you for visiting our website which covers about Chi Square Test For Association Calculator . We hope the information provided has been useful to you. Feel free to contact us if you have any questions or need further assistance. See you next time and don't miss to bookmark.
