Chi Square Test Of Association Calculator
Muz Play
Mar 24, 2025 · 6 min read
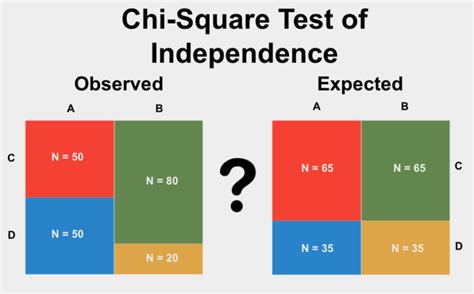
Table of Contents
Chi-Square Test of Association Calculator: A Comprehensive Guide
The chi-square test of association, also known as the chi-square test of independence, is a powerful statistical tool used to determine if there's a significant association between two categorical variables. Unlike tests comparing means or proportions, this test focuses on the relationship between frequencies within different categories. This article delves into the intricacies of the chi-square test of association, explaining its application, interpretation, and the use of calculators to simplify the process. We'll cover the underlying principles, assumptions, and potential limitations, equipping you with a thorough understanding of this essential statistical method.
Understanding the Chi-Square Test of Association
The core principle behind the chi-square test of association lies in comparing observed frequencies with expected frequencies. We hypothesize that the two categorical variables are independent – meaning there's no relationship between them. The test then assesses whether the observed data significantly deviates from this independence hypothesis. If the deviation is substantial, we reject the null hypothesis and conclude there's a statistically significant association.
Key Concepts:
- Categorical Variables: The chi-square test operates on categorical data, meaning data that can be divided into distinct categories or groups (e.g., gender, color, opinion).
- Contingency Table: The data is organized into a contingency table (also known as a cross-tabulation), showing the frequencies of each combination of categories for the two variables.
- Observed Frequencies: These are the actual counts observed in each cell of the contingency table.
- Expected Frequencies: These are the frequencies we'd expect if the two variables were truly independent. They are calculated based on the marginal totals of the contingency table.
- Chi-Square Statistic (χ²): This statistic measures the difference between observed and expected frequencies. A larger χ² value suggests a stronger association.
- Degrees of Freedom (df): This value reflects the number of independent pieces of information used to calculate the chi-square statistic. It's determined by the dimensions of the contingency table (rows - 1) * (columns - 1).
- P-value: This represents the probability of observing the obtained χ² value (or a more extreme value) if the null hypothesis (no association) were true. A small p-value (typically less than 0.05) indicates strong evidence against the null hypothesis, suggesting a significant association.
Steps Involved in Performing a Chi-Square Test of Association
While calculators automate much of the process, understanding the underlying steps provides valuable insight:
-
Formulate Hypotheses:
- Null Hypothesis (H₀): There is no association between the two categorical variables.
- Alternative Hypothesis (H₁): There is an association between the two categorical variables.
-
Create a Contingency Table: Organize your data into a contingency table showing the observed frequencies for each category combination.
-
Calculate Expected Frequencies: For each cell in the contingency table, calculate the expected frequency using the following formula:
(Row Total * Column Total) / Grand Total -
Calculate the Chi-Square Statistic (χ²): Use the following formula:
χ² = Σ [(Observed Frequency - Expected Frequency)² / Expected Frequency]The summation (Σ) is performed across all cells in the contingency table.
-
Determine Degrees of Freedom (df): Calculate the degrees of freedom using:
df = (Number of Rows - 1) * (Number of Columns - 1) -
Find the P-value: Use a chi-square distribution table or a statistical calculator to find the p-value associated with the calculated χ² value and degrees of freedom.
-
Interpret the Results:
- If the p-value is less than your chosen significance level (typically 0.05), reject the null hypothesis. There is a statistically significant association between the two variables.
- If the p-value is greater than your significance level, fail to reject the null hypothesis. There is not enough evidence to conclude a significant association.
Using a Chi-Square Test of Association Calculator
Numerous online calculators and statistical software packages can perform the chi-square test of association. These tools simplify the process by automating the calculations, reducing the risk of manual errors. Most calculators require you to input the observed frequencies from your contingency table. The calculator then performs the calculations and provides the χ² value, degrees of freedom, and p-value.
Benefits of using a calculator:
- Efficiency: Calculators significantly reduce the time and effort required for manual calculations, especially for larger contingency tables.
- Accuracy: They minimize the risk of calculation errors, ensuring reliable results.
- Ease of Use: Many calculators are user-friendly, requiring minimal statistical knowledge.
Assumptions and Limitations of the Chi-Square Test of Association
While a powerful tool, the chi-square test has certain assumptions and limitations:
- Independence of Observations: Each observation must be independent of the others. This means that the occurrence of one event shouldn't influence the occurrence of another.
- Expected Frequencies: Expected frequencies in each cell should ideally be at least 5. If expected frequencies are too low, the chi-square approximation may not be accurate. In such cases, alternative tests like Fisher's exact test might be more appropriate.
- Categorical Data: The test is designed specifically for categorical data. It cannot be applied to continuous variables directly.
- Strength of Association: While the chi-square test indicates the presence or absence of a significant association, it doesn't quantify the strength of that association. Measures like Cramer's V or phi coefficient can be used to assess the strength.
Interpreting the Results: Beyond Statistical Significance
A statistically significant p-value indicates an association, but it doesn't tell the whole story. Consider these points when interpreting results:
- Effect Size: A statistically significant result doesn't necessarily imply a practically important effect. A large sample size might lead to statistical significance even if the association is weak.
- Contextual Understanding: Always interpret the results within the context of the research question and the data itself.
- Causation vs. Correlation: The chi-square test only reveals associations, not causation. A significant association doesn't mean one variable causes the other. Other factors could be involved.
Advanced Applications and Considerations
- Chi-Square Test for Goodness of Fit: A variation of the chi-square test, it compares observed frequencies to expected frequencies from a theoretical distribution (e.g., comparing observed die rolls to the expected uniform distribution).
- McNemar's Test: Used specifically for paired nominal data, where each subject provides two responses.
- Yates' Correction for Continuity: A correction applied when expected frequencies are small, increasing the accuracy of the chi-square approximation.
Conclusion
The chi-square test of association is an indispensable tool for analyzing relationships between categorical variables. Understanding its principles, assumptions, and limitations, coupled with the efficient use of chi-square calculators, allows researchers and analysts to draw meaningful conclusions from their data. Remember to always consider the effect size, context, and the potential for confounding variables when interpreting the results. The appropriate use of this statistical test contributes significantly to robust and reliable data analysis. By carefully considering the nuances of this test and utilizing the available tools effectively, you can unlock valuable insights from your categorical data. The combination of theoretical understanding and practical application using calculators empowers you to perform accurate and insightful statistical analyses. This comprehensive guide ensures you're well-equipped to navigate the complexities of the chi-square test of association with confidence.
Latest Posts
Latest Posts
-
How To Find The Basis Of A Matrix
Mar 25, 2025
-
Atoms That Gain Electrons Are Called
Mar 25, 2025
-
How Many Valence Electrons Are In Iron
Mar 25, 2025
-
Solving Equations With Addition And Subtraction
Mar 25, 2025
-
Graphs Of Sine And Cosine Functions Answer Key
Mar 25, 2025
Related Post
Thank you for visiting our website which covers about Chi Square Test Of Association Calculator . We hope the information provided has been useful to you. Feel free to contact us if you have any questions or need further assistance. See you next time and don't miss to bookmark.
