Confidence Interval Calculator For 2 Samples
Muz Play
Mar 17, 2025 · 7 min read
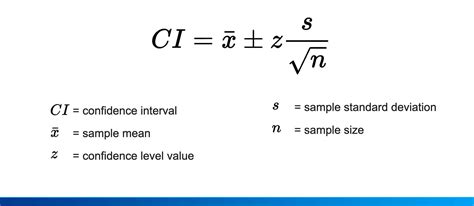
Table of Contents
Confidence Interval Calculator for 2 Samples: A Comprehensive Guide
Understanding the differences and relationships between two groups is a fundamental task in statistics. Whether comparing the effectiveness of two drugs, analyzing the average income between two cities, or assessing the performance of two marketing campaigns, determining if a statistically significant difference exists is crucial. This is where the confidence interval calculator for 2 samples comes into play. This tool allows you to determine, with a specific level of confidence, the range within which the true difference between the means of two populations lies. This article will delve into the intricacies of this crucial statistical tool, explaining its functionality, applications, underlying assumptions, and interpretations.
What is a Confidence Interval?
Before diving into the specifics of a two-sample confidence interval, let's solidify our understanding of confidence intervals in general. A confidence interval is a range of values within which we estimate a population parameter (like the mean) lies with a certain degree of confidence. This "degree of confidence" is typically expressed as a percentage, commonly 95%, but also could be 90%, 99%, or even higher.
For example: A 95% confidence interval for the average height of women means that if we were to repeatedly sample and calculate confidence intervals, 95% of those intervals would contain the true average height of women in the population. It does not mean there's a 95% chance the true average lies within this specific interval.
Types of Two-Sample Confidence Intervals
The type of confidence interval you need depends on the nature of your data and the type of comparison you're making. The most common scenarios involve:
1. Independent Samples:
This is the most frequent scenario. Independent samples imply that the two groups being compared are unrelated and the data points within each group are independent of each other. For example, comparing the test scores of students in two different schools. We use different calculations for independent samples depending on whether the population variances are assumed to be equal or unequal.
-
Equal Variances: When you assume the population variances are equal (often tested using a statistical test like Levene's test), a pooled variance is used in the calculation, leading to a more precise estimate.
-
Unequal Variances: When the population variances are unequal (more realistic in many real-world scenarios), a Welch's t-test approach is generally used. This approach doesn't assume equal variances, making it more robust.
2. Paired Samples:
Paired samples involve comparing two measurements taken from the same subjects or matched pairs. For example, measuring blood pressure before and after taking medication. Here, each individual contributes two data points, creating a pair. The analysis focuses on the differences between the paired measurements. Paired samples are often more powerful than independent samples because they control for individual variability.
How to Use a Two-Sample Confidence Interval Calculator
While the exact steps vary slightly depending on the calculator's interface, the basic input requirements remain consistent:
-
Sample Data: You'll need the sample means (average values) for each group, the sample standard deviations (measuring the spread of data within each group), and the sample sizes (number of observations) for each group.
-
Confidence Level: Specify the desired confidence level (e.g., 95%). This dictates how much uncertainty you are willing to accept. A higher confidence level leads to a wider interval.
-
Select the appropriate test: Indicate whether your samples are independent or paired. If independent, you may also be prompted to specify whether you assume equal variances or not.
-
Calculate: The calculator will then compute the confidence interval, providing you with the lower and upper bounds of the interval.
Interpretation: The confidence interval will show you the estimated range within which the true difference between the population means likely falls. For example, a 95% confidence interval of (2.5, 7.8) for the difference in average test scores between two groups indicates that you are 95% confident that the true difference in average test scores lies between 2.5 and 7.8 points.
Assumptions of Two-Sample Confidence Intervals
The accuracy and validity of the confidence intervals rely on certain assumptions:
-
Random Sampling: The samples must be randomly selected from their respective populations to ensure that the samples accurately represent the populations.
-
Independence: For independent samples, observations within each group must be independent of each other.
-
Normality: While many tests are reasonably robust to deviations from normality, especially with larger sample sizes (Central Limit Theorem), it's ideally best to have data that approximately follows a normal distribution within each group, or at least not have significant departures from normality. Transformations or non-parametric methods can be considered if normality is severely violated.
-
Equal Variances (for the pooled variance approach): When using the pooled variance method for independent samples, the assumption of equal population variances should be checked using a test such as Levene's test.
-
Data type: The data should be continuous or ordinal for most parametric approaches.
Interpreting the Results: Statistical Significance vs. Practical Significance
A key point to remember is that a confidence interval provides not only a range of plausible values but also indicates whether the difference between the groups is statistically significant. If the confidence interval does not contain zero (for difference in means), it suggests that there is a statistically significant difference between the population means at the chosen confidence level. Conversely, if the interval contains zero, it suggests that there is no statistically significant difference.
However, statistical significance does not automatically imply practical significance. A statistically significant difference might be very small and not meaningful in real-world terms. Consider the context of your data and the magnitude of the difference when drawing conclusions. A large sample size can lead to statistically significant results even with small differences.
Applications of Two-Sample Confidence Interval Calculators
The applications of two-sample confidence interval calculators are vast and span numerous fields:
-
Medicine: Comparing the efficacy of two treatments, analyzing differences in recovery times, or assessing the prevalence of a disease in two populations.
-
Education: Evaluating the effectiveness of different teaching methods, comparing student performance in different schools, or analyzing the impact of interventions.
-
Business and Marketing: Comparing sales figures for two products, analyzing customer satisfaction ratings for two services, or assessing the impact of two different advertising campaigns.
-
Engineering: Comparing the performance of two different designs, analyzing the reliability of two different components, or assessing the quality of two different manufacturing processes.
-
Social Sciences: Comparing attitudes or behaviors between two groups, analyzing differences in income or employment rates, or studying the impact of social programs.
Choosing the Right Test: A Deeper Dive
The choice of the correct statistical test and confidence interval calculation depends on several factors, including the type of data, the nature of the samples, and the assumptions met. Here’s a summary table:
| Sample Type | Variances | Test Used | Assumption of Normality |
|---|---|---|---|
| Independent | Equal | Pooled t-test | Yes (approximately) |
| Independent | Unequal | Welch's t-test | Yes (approximately) |
| Paired | N/A | Paired t-test | Yes (approximately) |
Non-parametric alternatives: If the normality assumption is severely violated, or your data is ordinal, non-parametric alternatives exist, such as the Mann-Whitney U test (for independent samples) or the Wilcoxon signed-rank test (for paired samples). These tests don't rely on normality assumptions.
Conclusion
The two-sample confidence interval calculator is a powerful tool for comparing the means of two groups and determining the likelihood of a true difference between them. It provides a range of plausible values for this difference, allowing for informed decision-making across various disciplines. While the calculator simplifies the computation, understanding the underlying statistical principles and assumptions is critical for accurate interpretation and proper application. Remember to consider both statistical and practical significance when analyzing the results. The choice of the appropriate test, based on the nature of your data and assumptions met, is paramount for drawing reliable conclusions. Always carefully consider the limitations of the tool and interpret the results within the context of the research question.
Latest Posts
Latest Posts
-
Electrons Are Located In Energy Levels Called Electron
Mar 17, 2025
-
Can Mitochondria Survive Outside The Cell
Mar 17, 2025
-
Name A Structural Difference Between Triglycerides And Phospholipids
Mar 17, 2025
-
Ending Materials In A Chemical Reaction
Mar 17, 2025
-
Get Energy By Eating Other Organisms
Mar 17, 2025
Related Post
Thank you for visiting our website which covers about Confidence Interval Calculator For 2 Samples . We hope the information provided has been useful to you. Feel free to contact us if you have any questions or need further assistance. See you next time and don't miss to bookmark.
