Confidence Interval Calculator For Two Independent Samples
Muz Play
Mar 31, 2025 · 6 min read
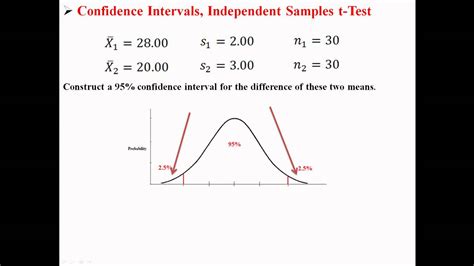
Table of Contents
Confidence Interval Calculator for Two Independent Samples: A Comprehensive Guide
Understanding the difference between populations is a cornerstone of statistical analysis. Often, we want to compare the means of two independent groups – perhaps comparing the effectiveness of two different drugs, the average income in two cities, or the test scores of students using different teaching methods. A confidence interval calculator for two independent samples provides a powerful tool for this comparison. This article delves deep into the concept, explaining its application, interpretation, and the assumptions underlying its use. We'll also explore different scenarios and provide practical examples to solidify your understanding.
What is a Confidence Interval?
Before diving into the specifics of two independent samples, let's establish a foundational understanding of confidence intervals. A confidence interval is a range of values that is likely to contain the true population parameter with a certain level of confidence. This "confidence level" is usually expressed as a percentage (e.g., 95%, 99%). A 95% confidence interval, for instance, means that if we were to repeat the sampling process many times, 95% of the calculated intervals would contain the true population parameter.
Key components of a confidence interval:
- Point Estimate: This is the best single guess for the population parameter (e.g., the sample mean).
- Margin of Error: This quantifies the uncertainty associated with the point estimate. It represents the range above and below the point estimate that encompasses the confidence interval.
- Confidence Level: The probability that the interval contains the true population parameter.
Confidence Interval for Two Independent Samples: The Basics
When comparing two independent samples, we are interested in the difference between their population means (µ1 - µ2). A confidence interval for this difference provides a range of plausible values for this difference. The formula for calculating this confidence interval depends on whether the population variances are assumed to be equal or unequal.
Assuming Equal Variances (Pooled t-test)
When we assume the population variances are equal, we use a pooled t-test to calculate the confidence interval. This method combines the information from both samples to estimate a common variance.
Formula:
(x̄₁ - x̄₂) ± t * √[s²p * (1/n₁ + 1/n₂)]
Where:
- x̄₁ and x̄₂ are the sample means of group 1 and group 2, respectively.
- n₁ and n₂ are the sample sizes of group 1 and group 2, respectively.
- s²p is the pooled variance, calculated as: [(n₁ - 1)s₁² + (n₂ - 1)s₂²] / (n₁ + n₂ - 2)
- s₁² and s₂² are the sample variances of group 1 and group 2, respectively.
- t is the critical t-value from the t-distribution with (n₁ + n₂ - 2) degrees of freedom and corresponding to the chosen confidence level.
Assuming Unequal Variances (Welch's t-test)
When we cannot assume equal variances (often checked using a test like Levene's test), we use Welch's t-test, which doesn't require this assumption.
Formula:
(x̄₁ - x̄₂) ± t * √[s₁²/n₁ + s₂²/n₂]
Where:
- x̄₁ and x̄₂ are the sample means of group 1 and group 2, respectively.
- n₁ and n₂ are the sample sizes of group 1 and group 2, respectively.
- s₁² and s₂² are the sample variances of group 1 and group 2, respectively.
- t is the critical t-value. The degrees of freedom for Welch's t-test is approximated using the Welch-Satterthwaite equation, which is more complex and typically calculated by statistical software.
Interpreting the Confidence Interval
The confidence interval for the difference between two means provides a range of values within which the true difference between the population means is likely to lie. Let's consider a few scenarios:
-
The interval contains zero: If the confidence interval includes zero, this suggests that there is not a statistically significant difference between the two population means at the chosen confidence level. There's a possibility that the true difference could be zero or even slightly negative or positive.
-
The interval does not contain zero: If the confidence interval does not contain zero, this suggests a statistically significant difference between the two population means. The sign of the values within the interval indicates the direction of the difference (positive indicates the mean of the first group is larger, negative indicates the mean of the second group is larger).
Assumptions of the Two-Sample t-test
The accuracy and validity of the confidence interval depend on several assumptions:
- Independence: The two samples must be independent of each other. Observations in one sample should not influence the observations in the other.
- Random Sampling: The samples should be randomly selected from their respective populations. This helps ensure that the samples are representative of the populations.
- Normality (approximately): The data within each group should be approximately normally distributed, or the sample sizes should be sufficiently large (generally, n ≥ 30). The Central Limit Theorem helps to mitigate the impact of non-normality with larger sample sizes.
- Equal Variances (for pooled t-test): The pooled t-test assumes that the population variances of the two groups are equal. Violation of this assumption can lead to inaccurate results.
Using a Confidence Interval Calculator
Many online calculators and statistical software packages (like R, SPSS, Python with SciPy) can compute confidence intervals for two independent samples. These tools simplify the calculations and provide clear results. Most calculators will prompt you to input the following information:
- Sample Means (x̄₁ and x̄₂)
- Sample Standard Deviations (s₁ and s₂)
- **Sample Sizes (n₁ and n₂) **
- Confidence Level (e.g., 95%)
- Whether to assume equal variances
Practical Example
Let's imagine we are comparing the effectiveness of two different fertilizers on plant growth. We have two independent samples:
- Fertilizer A: Sample mean (x̄₁) = 15 cm, sample standard deviation (s₁) = 2 cm, sample size (n₁) = 30
- Fertilizer B: Sample mean (x̄₂) = 12 cm, sample standard deviation (s₂) = 1.5 cm, sample size (n₂) = 35
Using a confidence interval calculator (assuming unequal variances for a more robust approach, as we don't have information confirming equal variances), and selecting a 95% confidence level, we might obtain a confidence interval of (1.8 cm, 4.2 cm). This suggests that the true mean difference in plant growth between Fertilizer A and Fertilizer B is likely between 1.8 cm and 4.2 cm, with Fertilizer A resulting in greater growth. Since the interval does not contain zero, the difference is statistically significant at the 95% confidence level.
Conclusion
The confidence interval calculator for two independent samples is a crucial tool for comparing the means of two groups. It provides a range of plausible values for the difference between the population means, allowing for a more nuanced interpretation than simply relying on a p-value from a hypothesis test. Understanding the assumptions, interpreting the results, and using appropriate software or online calculators are essential steps in making accurate and meaningful conclusions from your data. Remember to always consider the context of your research and the limitations of statistical inference when interpreting your results. Always check assumptions and consider alternative methods if assumptions are violated. Careful consideration of the methodology and interpretation will lead to more reliable conclusions.
Latest Posts
Latest Posts
-
Compare And Contrast Monotheism Polytheism And Animism
Apr 01, 2025
-
Is The Five Carbon Sugar Found In Dna
Apr 01, 2025
-
Builds A New Dna Strand By Adding Complementary Bases
Apr 01, 2025
-
Which Of The Following Situations Will Lead To Natural Selection
Apr 01, 2025
-
How Does The Nucleus And Ribosomes Work Together
Apr 01, 2025
Related Post
Thank you for visiting our website which covers about Confidence Interval Calculator For Two Independent Samples . We hope the information provided has been useful to you. Feel free to contact us if you have any questions or need further assistance. See you next time and don't miss to bookmark.
