Critical Value Table For Pearson's Correlation Coefficient
Muz Play
Apr 06, 2025 · 6 min read
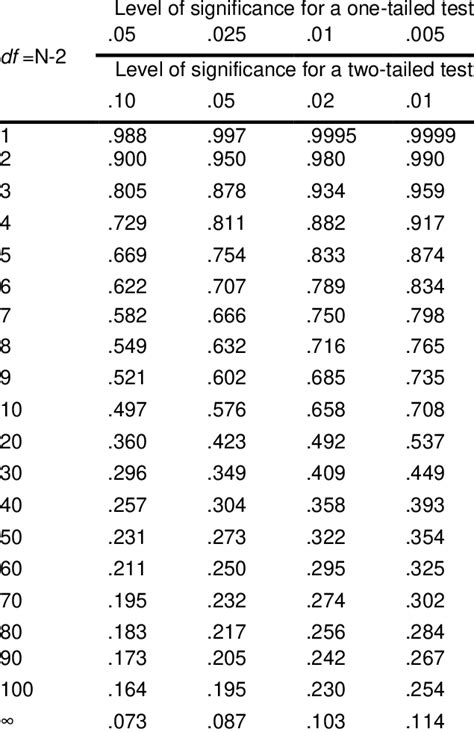
Table of Contents
Critical Value Table for Pearson's Correlation Coefficient: A Comprehensive Guide
The Pearson correlation coefficient, often denoted as r, is a fundamental statistical measure quantifying the linear association between two continuous variables. Understanding its critical values is crucial for hypothesis testing, determining the statistical significance of the correlation, and making informed conclusions about the relationship between your variables. This comprehensive guide delves into the intricacies of the critical value table for Pearson's correlation coefficient, explaining its use, interpretation, and limitations.
Understanding Pearson's Correlation Coefficient (r)
Before diving into critical values, let's refresh our understanding of r. This coefficient ranges from -1 to +1, with:
- +1: Indicating a perfect positive linear correlation (as one variable increases, the other increases proportionally).
- -1: Indicating a perfect negative linear correlation (as one variable increases, the other decreases proportionally).
- 0: Indicating no linear correlation.
It's vital to remember that r only measures linear relationships. A strong non-linear relationship might yield a low r value.
The Critical Value Table: Your Guide to Significance
The critical value table is a cornerstone of hypothesis testing with Pearson's r. It provides the minimum absolute value of r required to reject the null hypothesis – that there's no correlation between the variables (i.e., ρ = 0, where ρ represents the population correlation coefficient). Rejection of the null hypothesis implies a statistically significant correlation.
The critical value depends on two factors:
- Degrees of Freedom (df): This is calculated as df = n - 2, where n is the number of paired observations.
- Significance Level (α): This represents the probability of rejecting the null hypothesis when it's actually true (Type I error). Common significance levels are 0.05 (5%) and 0.01 (1%).
A critical value table typically presents these critical r values based on the df and α. If the absolute value of your calculated r exceeds the critical value for a given α, you reject the null hypothesis and conclude a statistically significant correlation exists at that significance level.
How to Use a Critical Value Table: A Step-by-Step Guide
Let's illustrate with a practical example. Suppose you calculate a Pearson correlation coefficient of r = 0.60 from a sample of n = 20 paired observations. You want to test the significance at α = 0.05.
-
Calculate Degrees of Freedom: df = n - 2 = 20 - 2 = 18.
-
Locate the Critical Value: Consult a critical value table for Pearson's r with df = 18 and α = 0.05 (two-tailed test). The table will provide the critical r value. For a two-tailed test, we are interested in both positive and negative correlations. A one-tailed test examines only positive or negative correlations.
-
Compare Your r to the Critical Value: Let's assume the critical value from the table is approximately 0.444. Since |0.60| > 0.444, your calculated r is greater than the critical value.
-
Interpret the Results: You reject the null hypothesis at the α = 0.05 significance level. This means there's statistically significant evidence of a linear correlation between your variables.
Interpreting the Critical Value Table: One-Tailed vs. Two-Tailed Tests
The critical value table needs to be interpreted correctly based on the type of hypothesis test you're conducting:
-
Two-Tailed Test: This tests for a correlation in either direction (positive or negative). You'll use the critical r value directly from the table.
-
One-Tailed Test: This tests for a correlation in a specific direction (either positive or negative). You'll need to adjust the significance level before consulting the table. For a one-tailed test at α = 0.05, you'd look up the critical value for α = 0.10 (double the alpha value for a two-tailed test). If your r value matches the direction of your hypothesis, and it is greater than the critical value from the table using the doubled significance level, it is statistically significant.
Limitations and Considerations
While the critical value table is a valuable tool, it's crucial to understand its limitations:
-
Linearity Assumption: The Pearson correlation coefficient only measures linear relationships. Non-linear relationships might not be accurately reflected in the r value, even if a strong association exists. Scatter plots are essential for visually inspecting the relationship between variables.
-
Outliers: Extreme values (outliers) can significantly influence the Pearson correlation coefficient. Identifying and handling outliers is essential for accurate interpretation. Robust correlation measures, less sensitive to outliers, might be considered in such cases.
-
Causation vs. Correlation: A statistically significant correlation does not imply causation. Correlation simply indicates an association; it doesn't prove one variable causes changes in the other. Other factors might be influencing the observed relationship.
-
Sample Size: The reliability of the correlation coefficient increases with sample size. With small sample sizes, even a seemingly large correlation might not be statistically significant. Conversely, a small correlation coefficient might be significant for a huge sample.
Beyond the Table: Statistical Software and Online Calculators
While critical value tables are readily available, statistical software packages (like SPSS, R, SAS, and Python with libraries like SciPy) offer more sophisticated hypothesis testing capabilities. These tools not only calculate the correlation coefficient but also provide p-values. The p-value represents the probability of observing the obtained correlation (or a stronger one) if there were truly no correlation. If the p-value is less than your significance level (e.g., 0.05), you reject the null hypothesis. This approach avoids the need to directly consult the critical value table and is particularly useful for more complex scenarios or larger datasets.
Choosing the Right Test: Correlation vs. Regression
It's important to distinguish between correlation analysis and regression analysis. While both deal with relationships between variables, they differ in their goals:
-
Correlation: Focuses on measuring the strength and direction of the linear relationship between two variables. It does not imply prediction or causation.
-
Regression: Aims to model the relationship between variables, often to predict the value of one variable based on the value of another. It enables the estimation of how much one variable changes in response to a change in another.
Conclusion: A Powerful Tool with Limitations
The critical value table for Pearson's correlation coefficient is a valuable tool for determining the statistical significance of linear relationships between continuous variables. However, proper interpretation requires understanding its limitations, including the assumptions of linearity, the potential impact of outliers, and the crucial distinction between correlation and causation. Utilizing statistical software for p-value calculation can enhance the accuracy and efficiency of your analysis. Always visualize your data with scatter plots to understand the nature of the relationship before drawing conclusions based on solely the correlation coefficient and its significance. A combination of visual inspection, statistical tests, and consideration of context is essential for robust interpretation of results. Remember that statistical significance does not necessarily imply practical significance – the magnitude and practical relevance of the correlation should also be carefully considered within the context of the research question.
Latest Posts
Latest Posts
-
What Does A Spontaneous Reaction Mean
Apr 09, 2025
-
Where Does The Second Stage Of Cellular Respiration Occur
Apr 09, 2025
-
Whats The Difference Between Hunger And Appetite
Apr 09, 2025
-
When The Mean Is Greater Than The Median
Apr 09, 2025
-
Percent Actual And Theoretical Yield Worksheet
Apr 09, 2025
Related Post
Thank you for visiting our website which covers about Critical Value Table For Pearson's Correlation Coefficient . We hope the information provided has been useful to you. Feel free to contact us if you have any questions or need further assistance. See you next time and don't miss to bookmark.