Draw The Shear And Moment Diagrams For The Beam.
Muz Play
Mar 19, 2025 · 6 min read
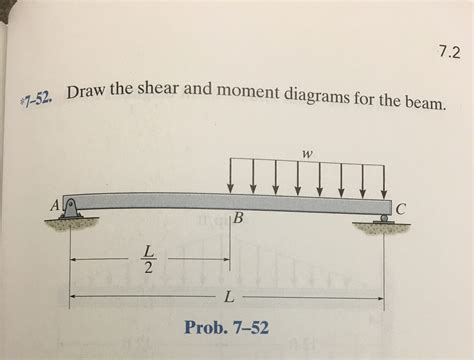
Table of Contents
Drawing Shear and Moment Diagrams for Beams: A Comprehensive Guide
Drawing accurate shear and moment diagrams is crucial in structural engineering. These diagrams visually represent the internal forces within a beam under various loading conditions, enabling engineers to assess stress, design appropriate sections, and ensure structural integrity. This comprehensive guide will walk you through the process of drawing shear and moment diagrams, covering various loading scenarios and providing practical tips for accurate representation.
Understanding Shear and Moment
Before diving into the drawing process, let's clarify the concepts of shear and moment in the context of beams:
Shear Force
Shear force is the internal force acting parallel to the cross-section of a beam, resisting the tendency of one part of the beam to slide past another. It's a result of external loads applied to the beam. A positive shear force indicates upward force on the left side of a section, while a negative shear force signifies downward force.
Bending Moment
Bending moment is the internal moment acting about the cross-section of a beam, resisting the tendency of the beam to bend or rotate. It's the sum of moments of external forces about a given point on the beam. A positive bending moment causes compression on the top surface and tension on the bottom, while a negative bending moment does the opposite.
Steps to Draw Shear and Moment Diagrams
The process involves a systematic approach, following these key steps:
-
Identify Supports and Reactions: Begin by identifying the type of supports (e.g., pinned, roller, fixed) and calculate the reactions at these supports using equilibrium equations (ΣFx = 0, ΣFy = 0, ΣM = 0). This step is fundamental to understanding the overall force distribution within the beam. Incorrect reaction calculations will lead to inaccurate shear and moment diagrams.
-
Draw the Free Body Diagram: Create a clear free body diagram (FBD) of the beam, showing all external loads and the calculated support reactions. The FBD provides a visual representation of all forces acting on the beam, essential for subsequent calculations.
-
Determine the Shear Force: Proceed along the beam from left to right (or vice versa). For each section, calculate the shear force by summing the vertical forces to the left (or right) of the section. Remember that concentrated loads cause abrupt changes in shear force, while uniformly distributed loads cause linear changes.
-
Determine the Bending Moment: After calculating the shear force, determine the bending moment at various points along the beam. The bending moment at a point is the algebraic sum of the moments of all forces to the left (or right) of that point. The moment arm is the perpendicular distance from the force to the point. Concentrated loads produce linear changes in the bending moment diagram, while uniformly distributed loads produce parabolic changes.
-
Plot the Shear and Moment Diagrams: Using the calculated shear forces and bending moments, plot the shear and moment diagrams on separate graphs, typically with the beam length on the horizontal axis and the shear force or bending moment on the vertical axis. Clearly label the values at significant points, such as points of maximum and minimum values.
Example: Simply Supported Beam with Point Load
Let's illustrate this process with a simple example: a simply supported beam of length L with a point load P at the midpoint.
-
Supports and Reactions: A simply supported beam has two supports, typically a pinned support at one end and a roller support at the other. Using equilibrium equations, we find that the reaction at each support is P/2.
-
Free Body Diagram: The FBD shows the beam, the point load P at L/2, and the reactions P/2 at each support.
-
Shear Force: Moving from left to right:
- From 0 to L/2: Shear force = P/2 (constant)
- At L/2: Shear force jumps down by P, becoming -P/2.
- From L/2 to L: Shear force = -P/2 (constant)
-
Bending Moment:
- At 0: Moment = 0
- At L/2: Moment = (P/2)(L/2) = PL/4 (maximum moment)
- At L: Moment = 0
-
Diagrams: The shear diagram will show a horizontal line at P/2 from 0 to L/2, a sudden drop to -P/2 at L/2, and then a horizontal line at -P/2 to L. The moment diagram will be a triangle, with a peak value of PL/4 at the midpoint.
Different Loading Scenarios
The procedure remains similar for various loading conditions; however, the resulting diagrams will vary:
Uniformly Distributed Load (UDL)
A UDL causes a linear change in shear force and a parabolic change in the bending moment. The shear force diagram will be a straight line with a slope equal to the intensity of the UDL, while the bending moment diagram will be a parabola.
Triangular Load
A triangular load results in a parabolic shear force diagram and a cubic bending moment diagram.
Multiple Loads
With multiple concentrated loads and UDLs, a piecewise approach is necessary. Calculate shear force and bending moment between each load point, ensuring continuity at load points.
Advanced Techniques and Considerations
Macaulay's Method
For complex loading scenarios with multiple concentrated loads and UDLs, Macaulay's method simplifies the calculation of shear and bending moments. This method utilizes discontinuous functions to represent the various load segments.
Influence Lines
Influence lines provide a graphical representation of how the shear and bending moment at a specific point change as a unit load moves across the beam. These are helpful for analyzing the effects of moving loads like vehicles on bridges.
Computer-Aided Design (CAD) Software
Modern CAD software packages significantly simplify the creation of shear and moment diagrams. These tools often automate the calculations and provide high-quality graphical output. However, understanding the fundamental principles remains vital for interpretation and validation of software results.
Tips for Accurate Diagram Creation
-
Neatness and Clarity: Use a ruler and clearly label all points, values, and units on the diagrams. A well-presented diagram is easier to interpret.
-
Consistency: Maintain consistency in sign conventions throughout the process.
-
Check for Errors: Always verify your calculations and diagram by checking for equilibrium at critical points.
Conclusion
Drawing shear and moment diagrams is a fundamental skill for structural engineers. By mastering the steps outlined in this guide and understanding the underlying principles, you can accurately represent internal forces within beams, leading to sound structural designs and ensuring safety and stability. Remember that practice is key to becoming proficient in this essential aspect of structural analysis. Work through numerous examples, varying the types of beams and load scenarios, to enhance your understanding and build confidence in generating accurate and reliable shear and bending moment diagrams.
Latest Posts
Latest Posts
-
Where Are The Focus Controls On A Microscope Located
Mar 19, 2025
-
Non Homogeneous First Order Differential Equation
Mar 19, 2025
-
Using Inverse Matrix To Solve System Of Linear Equations
Mar 19, 2025
-
Is H2o An Acid Or Base
Mar 19, 2025
-
What Are The Membrane Bound Organelles
Mar 19, 2025
Related Post
Thank you for visiting our website which covers about Draw The Shear And Moment Diagrams For The Beam. . We hope the information provided has been useful to you. Feel free to contact us if you have any questions or need further assistance. See you next time and don't miss to bookmark.
