Formula For Confidence Interval For Population Proportion
Muz Play
Mar 23, 2025 · 6 min read
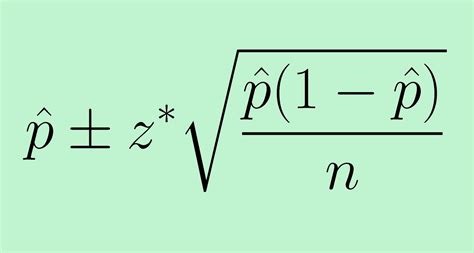
Table of Contents
- Formula For Confidence Interval For Population Proportion
- Table of Contents
- The Formula for Confidence Interval for Population Proportion: A Comprehensive Guide
- What is a Confidence Interval for Population Proportion?
- The Formula and Its Components
- Understanding the Components in Detail
- Assumptions and Conditions
- Applying the Formula: Examples
- Interpreting and Reporting Confidence Intervals
- Advanced Considerations: Exact Methods and Other Intervals
- Conclusion
- Latest Posts
- Latest Posts
- Related Post
The Formula for Confidence Interval for Population Proportion: A Comprehensive Guide
Understanding and applying the formula for a confidence interval for a population proportion is crucial in statistical inference. This comprehensive guide delves into the intricacies of this formula, explaining its components, assumptions, and practical applications. We'll explore different scenarios, including situations with large and small sample sizes, and offer practical tips for accurate interpretation and reporting.
What is a Confidence Interval for Population Proportion?
Before diving into the formula, let's define the concept. A confidence interval provides a range of values within which we estimate a population parameter lies with a certain degree of confidence. In the context of population proportion (often denoted as 'p'), this means estimating the true proportion of a population possessing a specific characteristic. For example, we might want to estimate the proportion of voters who favor a particular candidate, the percentage of defective items in a production batch, or the fraction of people who own a pet.
The confidence interval is not a definitive statement about the true population proportion; rather, it expresses a range of plausible values. The level of confidence, typically expressed as a percentage (e.g., 95%, 99%), indicates the probability that the interval contains the true population proportion. A higher confidence level results in a wider interval, reflecting greater certainty but less precision.
The Formula and Its Components
The formula for calculating a confidence interval for a population proportion is:
CI = p̂ ± Z * √[(p̂(1-p̂))/n]
Where:
- CI: Represents the confidence interval.
- p̂ (p-hat): This is the sample proportion, calculated as the number of successes (individuals with the characteristic of interest) divided by the total sample size. It's our best point estimate of the population proportion.
- Z: This is the Z-score corresponding to the desired confidence level. It represents the number of standard deviations from the mean of the standard normal distribution. For example:
- 95% confidence level: Z = 1.96
- 99% confidence level: Z = 2.58
- 90% confidence level: Z = 1.645
- n: This is the sample size, representing the total number of individuals in the sample.
Understanding the Components in Detail
Let's break down each component to enhance our understanding:
1. Sample Proportion (p̂): This is the cornerstone of our calculation. It's obtained directly from the sample data and serves as the best estimate we have for the unknown population proportion. Accurate data collection and a representative sample are crucial for a reliable p̂.
2. Z-score: The Z-score links the confidence level to the standard normal distribution. It determines the width of the confidence interval. Higher confidence levels require larger Z-scores, resulting in wider intervals. This reflects the trade-off between confidence and precision.
3. Standard Error (√[(p̂(1-p̂))/n]): This term quantifies the uncertainty associated with our sample proportion. It measures how much the sample proportion is likely to vary from the true population proportion. Notice that: * A larger sample size (n) reduces the standard error, leading to a narrower confidence interval. * The standard error is largest when p̂ is 0.5. This is because the variance is maximized at p̂ = 0.5. When p̂ is closer to 0 or 1, the standard error decreases, reflecting less uncertainty.
Assumptions and Conditions
The validity of the confidence interval relies on several assumptions:
- Random Sampling: The sample must be randomly selected from the population to ensure it's representative and unbiased. Non-random sampling can introduce bias and invalidate the results.
- Independence: Observations within the sample must be independent. This means that the outcome of one observation should not influence the outcome of another. Violation of this assumption can affect the accuracy of the standard error calculation.
- Sample Size: The sample size should be sufficiently large. A commonly used rule of thumb is that both np̂ ≥ 10 and n(1-p̂) ≥ 10. This ensures the sampling distribution of p̂ is approximately normal, allowing us to use the Z-score. If this condition is not met, we may need to use alternative methods, such as the Wilson score interval or exact methods.
Applying the Formula: Examples
Let's illustrate the formula with practical examples:
Example 1: Large Sample Size
Suppose a survey of 1000 randomly selected adults reveals that 600 support a particular policy. Calculate the 95% confidence interval for the population proportion.
- n = 1000
- Number of successes = 600
- p̂ = 600/1000 = 0.6
- Z (for 95% confidence) = 1.96
CI = 0.6 ± 1.96 * √[(0.6 * 0.4)/1000] CI = 0.6 ± 0.0304 CI = (0.5696, 0.6304)
We are 95% confident that the true population proportion of adults supporting the policy lies between 56.96% and 63.04%.
Example 2: Small Sample Size - Considering Adjustments
Consider a smaller sample of 50 adults where 30 support the policy. Here, np̂ = 30 and n(1-p̂) = 20, both are greater than 10; therefore, the normal approximation is still reasonably valid.
- n = 50
- Number of successes = 30
- p̂ = 30/50 = 0.6
- Z (for 95% confidence) = 1.96
CI = 0.6 ± 1.96 * √[(0.6 * 0.4)/50] CI = 0.6 ± 0.0876 CI = (0.5124, 0.6876)
Notice that the confidence interval is wider than in the previous example due to the smaller sample size.
Interpreting and Reporting Confidence Intervals
When reporting a confidence interval, it's crucial to state the confidence level and interpret the results correctly. For example:
"Based on a sample of 1000 adults, we are 95% confident that the true proportion of adults supporting the policy lies between 56.96% and 63.04%."
This statement correctly conveys both the uncertainty and the level of confidence associated with the estimate. It is vital to avoid misinterpretations such as claiming there is a 95% chance the true proportion falls within this interval. The 95% refers to the reliability of the method used to construct the interval, not the probability of the true proportion falling within a specific interval.
Advanced Considerations: Exact Methods and Other Intervals
For small sample sizes where the normal approximation is questionable (np̂ < 10 or n(1-p̂) < 10), using the Wilson score interval or an exact method (like Clopper-Pearson interval) is recommended. These methods provide more accurate confidence intervals, especially when dealing with extreme proportions near 0 or 1. The Wilson score interval, in particular, is known for its better performance and is often preferred over the normal approximation, even for moderately sized samples.
Conclusion
The formula for a confidence interval for a population proportion is a powerful tool for statistical inference. By understanding its components, assumptions, and limitations, we can use it effectively to estimate population proportions with appropriate levels of confidence. Remember to always consider the sample size, check the conditions for normality, and report the results accurately and transparently. For small sample sizes, consider employing more accurate methods like the Wilson score interval to avoid potential biases. Mastering this formula is essential for anyone working with statistical data and aiming to draw meaningful conclusions from sample information.
Latest Posts
Latest Posts
-
Which Organ Is An Accessory Organ Of Digestion
Mar 26, 2025
-
What Is The Difference Between Gene Mutations And Chromosomal Mutations
Mar 26, 2025
-
What Is A Positively Charged Subatomic Particle
Mar 26, 2025
-
The Is The Fundamental Unit Of Life
Mar 26, 2025
-
How Many Phosphates Does Adp Have
Mar 26, 2025
Related Post
Thank you for visiting our website which covers about Formula For Confidence Interval For Population Proportion . We hope the information provided has been useful to you. Feel free to contact us if you have any questions or need further assistance. See you next time and don't miss to bookmark.
