Graph Of A Second Order Reaction
Muz Play
Mar 16, 2025 · 7 min read
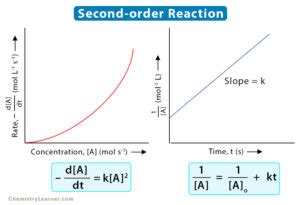
Table of Contents
Understanding the Graph of a Second-Order Reaction
Chemical kinetics is a fascinating field that explores the rates of chemical reactions. Within this field, understanding reaction orders is crucial for predicting reaction behavior and designing efficient processes. Second-order reactions, where the rate depends on the concentration of two reactants or the square of a single reactant's concentration, exhibit unique graphical characteristics that we will explore in detail. This article will delve deep into the graphs of second-order reactions, explaining their interpretation, derivation, and practical applications.
Defining Second-Order Reactions
A second-order reaction is one whose rate is proportional to the square of the concentration of a single reactant (A) or to the product of the concentrations of two reactants (A and B). This is expressed mathematically as:
- For a reaction of the type 2A → products: Rate = k[A]²
- For a reaction of the type A + B → products: Rate = k[A][B]
Where:
- k is the rate constant (a proportionality constant specific to the reaction and temperature).
- [A] and [B] represent the concentrations of reactants A and B, respectively.
The units of the rate constant, k, vary depending on the overall order of the reaction. For a second-order reaction, the units are typically M⁻¹s⁻¹ (where M represents molarity and s represents seconds).
Graphical Representation: Integrated Rate Laws
Unlike zero-order and first-order reactions, the integrated rate law for second-order reactions is not linear when plotted directly against time. To obtain linear plots and extract meaningful information, we need to manipulate the integrated rate laws.
1. Second-Order Reaction with One Reactant (2A → products)
The integrated rate law for a second-order reaction with one reactant is:
1/[A]<sub>t</sub> = kt + 1/[A]<sub>0</sub>
Where:
- [A]<sub>t</sub> is the concentration of reactant A at time t.
- [A]<sub>0</sub> is the initial concentration of reactant A at time t=0.
Graph: When 1/[A]<sub>t</sub> is plotted against time (t), a straight line is obtained.
- Slope: The slope of the line is equal to the rate constant, k.
- y-intercept: The y-intercept is equal to 1/[A]<sub>0</sub>.
This linear relationship is extremely useful for determining the rate constant and initial concentration experimentally. By performing measurements at various time intervals and plotting the data accordingly, one can easily extract the rate constant directly from the graph's slope.
Example: Imagine a reaction where the concentration of reactant A is monitored over time. By calculating the reciprocal of the concentration at each time point and plotting these values against the corresponding times, a straight-line graph indicates a second-order reaction. The slope's magnitude gives the value of 'k', providing a quantitative measure of the reaction's speed.
2. Second-Order Reaction with Two Reactants (A + B → products)
The integrated rate law for a second-order reaction with two reactants is more complex and depends on whether the initial concentrations of A and B are equal or unequal.
a) Equal Initial Concentrations ([A]<sub>0</sub> = [B]<sub>0</sub>):
The integrated rate law simplifies to:
1/[A]<sub>t</sub> - 1/[A]<sub>0</sub> = kt
This equation is similar to the one-reactant case; plotting 1/[A]<sub>t</sub> against time gives a straight line with a slope of k.
b) Unequal Initial Concentrations ([A]<sub>0</sub> ≠ [B]<sub>0</sub>):
The integrated rate law becomes:
(1/([B]<sub>0</sub> - [A]<sub>0</sub>)) * ln(([A]<sub>0</sub>/[B]<sub>0</sub>) * ([B]<sub>t</sub>/[A]<sub>t</sub>)) = kt
This equation is more challenging to analyze graphically. While a direct plot won't yield a straight line, more sophisticated analysis techniques or numerical methods can be employed to determine the rate constant. This often involves using specialized software or data fitting procedures. For this more complex case, the graphical method is less straightforward and often replaced by numerical integration methods.
Half-life of a Second-Order Reaction
The half-life (t<sub>1/2</sub>) is the time required for the concentration of a reactant to decrease to half its initial value. For a second-order reaction with one reactant (2A → products):
t<sub>1/2</sub> = 1/(k[A]<sub>0</sub>)
Key Observation: Unlike first-order reactions, the half-life of a second-order reaction depends on the initial concentration of the reactant. This means that the time it takes for the concentration to halve is not constant; it increases with decreasing concentration. The higher the initial concentration, the shorter the half-life.
This dependency on initial concentration is a hallmark of second-order reactions and provides a valuable way to distinguish them from other reaction orders. By observing how the half-life changes as the initial concentration is varied, a chemist can definitively determine if the reaction is second-order.
Practical Applications and Significance
The study of second-order reaction kinetics is essential in numerous fields:
-
Environmental Chemistry: Understanding the degradation rates of pollutants, such as the decomposition of ozone-depleting substances, often involves second-order kinetics. Models predicting pollutant decay in the environment heavily rely on accurate determination of second-order rate constants.
-
Catalysis: Many catalytic reactions follow second-order kinetics, with the catalyst affecting the rate constant. This knowledge is crucial in optimizing catalytic processes for industrial applications, enabling efficient production of chemicals and materials.
-
Pharmacokinetics: Drug metabolism and elimination processes in the body can sometimes follow second-order kinetics. Understanding these processes is vital in designing effective drug delivery systems and optimizing drug dosages.
-
Polymer Chemistry: Polymerization reactions often exhibit second-order kinetics. Analyzing these reaction rates is essential in controlling the molecular weight and properties of the resulting polymers.
-
Atmospheric Chemistry: Reactions in the atmosphere, such as the formation of smog components, often involve second-order kinetics. Accurate kinetic models are necessary for understanding and predicting air quality.
Distinguishing Between Reaction Orders
It's vital to differentiate between zero-order, first-order, and second-order reactions. The graphical analysis described above, specifically the linear relationship obtained by plotting the appropriate function of concentration versus time, is the primary tool for this differentiation:
- Zero-order: A plot of [A]<sub>t</sub> vs. t gives a straight line.
- First-order: A plot of ln[A]<sub>t</sub> vs. t gives a straight line.
- Second-order: A plot of 1/[A]<sub>t</sub> vs. t gives a straight line (for a single reactant).
This graphical approach allows experimental chemists to definitively determine the reaction order by analyzing the linear relationships exhibited by different functions of concentration against time.
Advanced Techniques and Considerations
While the graphical method provides a straightforward way to analyze second-order reactions, more advanced techniques are sometimes necessary:
-
Numerical Integration: For complex second-order reactions or when precise rate constants are needed, numerical integration methods are often preferred. These methods utilize computer algorithms to solve the integrated rate law equations, often providing more accurate results than graphical analysis, especially when experimental data has significant scatter.
-
Non-linear regression: Statistical methods such as non-linear regression can be used to fit experimental data to the integrated rate law, providing estimates of the rate constant and associated uncertainties. This is particularly useful for datasets with noise or a limited number of data points.
-
Temperature Dependence: The rate constant (k) is temperature-dependent, following the Arrhenius equation. By performing experiments at different temperatures and plotting ln k against 1/T (absolute temperature), the activation energy (Ea) of the reaction can be determined. This information further enhances the understanding of the reaction mechanism.
Conclusion
Understanding the graph of a second-order reaction is fundamental to chemical kinetics. The ability to generate and interpret these graphs allows researchers and engineers to quantitatively determine rate constants, half-lives, and other critical parameters that govern reaction behavior. The graphical method provides a visual and intuitive approach for analyzing experimental data and distinguishing between different reaction orders. While graphical analysis is often the first step, advanced techniques, such as numerical integration and non-linear regression, are sometimes needed to obtain more precise results and handle complexities arising in real-world chemical systems. The principles and methods discussed in this article are applicable across various scientific and engineering disciplines, emphasizing the importance and widespread utility of second-order reaction kinetics.
Latest Posts
Latest Posts
-
Heaviest To Lightest Cocm Pund Atom Proton Electron
Mar 17, 2025
-
Is The Ability To Make An Object Appear Larger
Mar 17, 2025
-
Which Of The Following Ions Would Be Considered An Anion
Mar 17, 2025
-
The Only Nonmetal In Group 1
Mar 17, 2025
-
How To Get The Average Acceleration
Mar 17, 2025
Related Post
Thank you for visiting our website which covers about Graph Of A Second Order Reaction . We hope the information provided has been useful to you. Feel free to contact us if you have any questions or need further assistance. See you next time and don't miss to bookmark.
