How Do You Calculate Index Numbers
Muz Play
Mar 26, 2025 · 6 min read
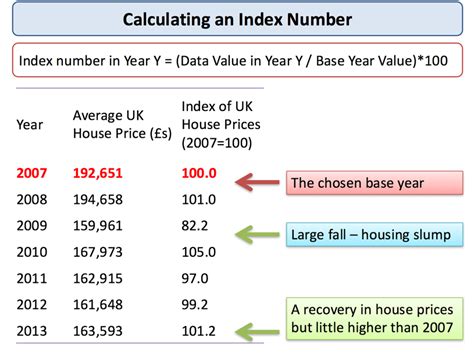
Table of Contents
How Do You Calculate Index Numbers? A Comprehensive Guide
Index numbers are powerful statistical tools used to track changes in a variable over time or across different groups. They provide a standardized way to compare data, revealing trends and patterns that might otherwise be obscured by raw data's inherent complexities. Understanding how to calculate index numbers is crucial for analysts, economists, and anyone working with time-series or comparative data. This comprehensive guide will explore the various methods, considerations, and applications of index number calculations.
Understanding the Fundamentals of Index Numbers
Before diving into the calculations, let's clarify the core concepts. An index number represents the relative change in a variable compared to a base period. The base period is an arbitrarily chosen reference point, often a specific year or month, assigned an index value of 100. Subsequent periods' index numbers show the percentage change from this base. For example, an index number of 120 in a later period indicates a 20% increase compared to the base period.
Key Components of Index Numbers:
- Base Period: The reference point for comparison. Its index value is always 100.
- Current Period: The period being compared to the base period.
- Index Number: The calculated value representing the relative change between the current and base periods.
- Weighting (if applicable): Assigning different importance to various components of the index. This is particularly crucial in composite indices, as discussed later.
Types of Index Numbers
Several types of index numbers exist, each suited for different data and analytical objectives. The most common include:
- Price Index Numbers: Measure changes in the price of goods and services over time. Examples include the Consumer Price Index (CPI) and the Producer Price Index (PPI).
- Quantity Index Numbers: Track changes in the volume or quantity of goods and services produced or consumed.
- Value Index Numbers: Reflect changes in the overall value of a variable, often incorporating both price and quantity changes.
Calculating Simple Index Numbers
The simplest form of index number calculation involves a single variable. Let's consider a scenario where we track the price of a single commodity, say, wheat, over several years:
| Year | Price of Wheat (USD/bushel) |
|---|---|
| 2015 | 5 |
| 2016 | 6 |
| 2017 | 7 |
| 2018 | 8 |
Choosing a Base Year: Let's choose 2015 as our base year.
Calculation:
The simple index number for each year is calculated as follows:
(Price in Current Year / Price in Base Year) * 100
- 2015: (5/5) * 100 = 100
- 2016: (6/5) * 100 = 120
- 2017: (7/5) * 100 = 140
- 2018: (8/5) * 100 = 160
This shows a steady increase in the price of wheat over the four years.
Calculating Weighted Index Numbers
When dealing with multiple items or components, a simple average is often insufficient. Weighted index numbers account for the relative importance of each component through assigned weights. These weights can reflect factors like market share, consumption patterns, or production volumes. Two common methods for calculating weighted index numbers are:
1. Laspeyres Index
The Laspeyres index uses the quantities consumed (or produced) in the base year as weights. This means that the relative importance of each component remains constant over time, based on their significance in the base year.
Formula:
Laspeyres Index = ∑(P<sub>t</sub> * Q<sub>0</sub>) / ∑(P<sub>0</sub> * Q<sub>0</sub>) * 100
Where:
- P<sub>t</sub> = Price in the current period
- P<sub>0</sub> = Price in the base period
- Q<sub>0</sub> = Quantity in the base period
2. Paasche Index
The Paasche index uses the quantities consumed (or produced) in the current period as weights. This means the weights adjust each period, reflecting the changing importance of each component.
Formula:
Paasche Index = ∑(P<sub>t</sub> * Q<sub>t</sub>) / ∑(P<sub>0</sub> * Q<sub>t</sub>) * 100
Where:
- P<sub>t</sub> = Price in the current period
- P<sub>0</sub> = Price in the base period
- Q<sub>t</sub> = Quantity in the current period
Example: Calculating Laspeyres and Paasche Indices
Let's consider two commodities, A and B, with their prices and quantities over two years:
| Commodity | Price 2015 (P<sub>0</sub>) | Quantity 2015 (Q<sub>0</sub>) | Price 2016 (P<sub>t</sub>) | Quantity 2016 (Q<sub>t</sub>) |
|---|---|---|---|---|
| A | 10 | 50 | 12 | 60 |
| B | 20 | 25 | 25 | 30 |
Laspeyres Index (2016):
∑(P<sub>t</sub> * Q<sub>0</sub>) = (12 * 50) + (25 * 25) = 600 + 625 = 1225 ∑(P<sub>0</sub> * Q<sub>0</sub>) = (10 * 50) + (20 * 25) = 500 + 500 = 1000 Laspeyres Index = (1225/1000) * 100 = 122.5
Paasche Index (2016):
∑(P<sub>t</sub> * Q<sub>t</sub>) = (12 * 60) + (25 * 30) = 720 + 750 = 1470 ∑(P<sub>0</sub> * Q<sub>t</sub>) = (10 * 60) + (20 * 30) = 600 + 600 = 1200 Paasche Index = (1470/1200) * 100 = 122.5
In this example, both indices yield the same result, though this isn't always the case.
Choosing Between Laspeyres and Paasche Indices
The choice between Laspeyres and Paasche indices depends on the specific application and available data. Laspeyres is simpler to calculate because it requires only base-year quantities. However, it can overstate increases (or understate decreases) because it doesn't account for changes in consumption patterns. Paasche, conversely, incorporates current-period quantities but requires more data and can be more complex to compute. Often, a combination of both or other methods, such as Fisher's Ideal Index (geometric mean of Laspeyres and Paasche), is used to mitigate the limitations of each individual index.
Other Important Considerations
- Data Quality: Accurate and reliable data is paramount for meaningful index number calculations. Errors in the raw data will directly impact the results.
- Base Period Selection: The choice of base period can affect the interpretation of the index. A period with unusual economic activity might distort subsequent comparisons.
- Weighting Schemes: Appropriate weighting is crucial in composite indices. Inaccurate or inappropriate weights can lead to misleading results.
- Index Number Splicing: If a break occurs in the time series (e.g., a change in methodology), techniques like index number splicing are employed to create a continuous series.
Applications of Index Numbers
Index numbers have widespread applications across various fields, including:
- Economic Analysis: Monitoring inflation, tracking economic growth, comparing national income across countries.
- Business and Finance: Measuring productivity, analyzing sales trends, assessing investment performance.
- Market Research: Tracking consumer preferences, analyzing market share changes, evaluating the effectiveness of marketing campaigns.
- Government Policy: Informing policy decisions related to economic planning, taxation, and social welfare programs.
Conclusion
Calculating index numbers involves a systematic approach, depending on the data type and analytical goals. Understanding the different types of index numbers, their respective calculation methods (simple, weighted, Laspeyres, Paasche, etc.), and the inherent limitations of each is essential for accurate interpretation. The choice of method depends critically on the specific application and the availability of data. With careful consideration of these factors, index numbers can provide invaluable insights into trends, changes, and comparisons across various variables over time or across different groups. They serve as a powerful tool for both descriptive analysis and predictive modeling in numerous fields. Therefore, mastering the art of calculating and interpreting index numbers is a valuable skill for anyone dealing with quantitative data analysis.
Latest Posts
Latest Posts
-
What Is A Solution To An Equation
Mar 29, 2025
-
This Is Water By David Foster Wallace Pdf
Mar 29, 2025
-
Type I And Type Ii Errors Examples
Mar 29, 2025
-
In Cellular Respiration Most Atp Molecules Are Produced By
Mar 29, 2025
-
What Is The Power Stroke In Muscle Contraction
Mar 29, 2025
Related Post
Thank you for visiting our website which covers about How Do You Calculate Index Numbers . We hope the information provided has been useful to you. Feel free to contact us if you have any questions or need further assistance. See you next time and don't miss to bookmark.
