How To Calculate Lx Life Table
Muz Play
Apr 07, 2025 · 7 min read
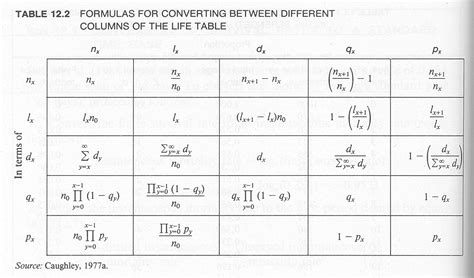
Table of Contents
How to Calculate lx in a Life Table: A Comprehensive Guide
Life tables are fundamental tools in demography, actuarial science, and public health. They provide a snapshot of a population's mortality experience, allowing for the calculation of various key indicators like life expectancy and death rates. A crucial component of any life table is the lx column, representing the number of individuals surviving to a given age. This article provides a comprehensive guide on how to calculate lx in a life table, explaining the underlying concepts, methods, and interpretations.
Understanding the Components of a Life Table
Before diving into the calculation of lx, let's review the essential components of a life table:
-
Age Interval (x): This represents the age range considered (e.g., 0-1, 1-5, 5-10, etc.). The intervals can be of varying lengths, depending on the data available and the research objectives.
-
Number of Deaths (dx): This is the number of individuals who die within a specific age interval. These data are often obtained from mortality statistics.
-
Number of Survivors (lx): This is the crucial component we'll focus on—the number of individuals surviving to the beginning of a given age interval. It's also sometimes referred to as the "radix" of the life table.
-
Proportion Dying (qx): This represents the probability of dying within a given age interval. It's calculated as
dx / lx. -
Proportion Surviving (px): This is the probability of surviving through a given age interval. It's calculated as
1 - qxorlx+n / lx(where 'n' represents the width of the age interval). -
Life Expectancy (ex): This represents the average number of years of life remaining for an individual who has reached a given age.
Calculating lx: The Step-by-Step Process
The calculation of lx begins with defining a starting population, often called the radix (l₀). This radix represents the hypothetical number of individuals entering the life table at age 0. While you can choose any reasonable number (often 100,000 for ease of interpretation), the actual value doesn't affect the relative proportions of survivors at different ages.
Here's the step-by-step process:
1. Determining the Radix (l₀)
The radix (l₀) is the starting point. You typically choose a convenient number, like 100,000, to make the calculations and interpretation more straightforward. This number represents the hypothetical cohort entering the life table at age 0.
2. Calculating lx for Subsequent Age Intervals
Once you've established the radix, you calculate lx for subsequent age intervals using the following formula:
lx+n = lx - dx
Where:
lx+nrepresents the number of survivors at the beginning of the next age interval.lxis the number of survivors at the beginning of the current age interval.dxis the number of deaths within the current age interval.
Let's illustrate with an example. Suppose you have the following data:
| Age Interval (x) | dx (Number of Deaths) |
|---|---|
| 0-1 | 1000 |
| 1-5 | 500 |
| 5-10 | 200 |
| 10-15 | 100 |
And we choose a radix of l₀ = 100,000.
Here's how we calculate lx for each age interval:
-
l₀ = 100,000 (radix)
-
l₁ = l₀ - d₀ = 100,000 - 1000 = 99,000 (Survivors at age 1)
-
l₅ = l₁ - d₁ = 99,000 - 500 = 98,500 (Survivors at age 5; note that d₁ represents deaths between ages 1 and 5)
-
l₁₀ = l₅ - d₂ = 98,500 - 200 = 98,300 (Survivors at age 10)
-
l₁₅ = l₁₀ - d₃ = 98,300 - 100 = 98,200 (Survivors at age 15)
And so on for subsequent age intervals. You continue this process until you reach the end of your age range.
3. Handling Different Age Interval Widths
The above example used consistent age intervals. However, life tables often include intervals of varying widths (e.g., 0-1, 1-4, 5-9, 10-14, 15+). In such cases, you need to adjust the calculation slightly. Instead of simply subtracting deaths, you need to consider the proportion of deaths within the interval. One approach is to use the formula:
lx+n = lx * (1 - qx)
Where:
qxis the probability of dying within the age interval, calculated asdx/lx.
This approach accounts for the varying interval lengths, ensuring a more accurate representation of survival.
Different Types of Life Tables and their Impact on lx Calculations
Several types of life tables exist, each using slightly different methods for calculating lx:
-
Cohort Life Table: This type follows a specific cohort (group of individuals born at the same time) throughout their lives.
lxrepresents the actual number of survivors in that cohort at each age. -
Period Life Table: This type uses mortality data from a specific period (e.g., a year) to construct a hypothetical cohort. It represents a snapshot of mortality experience during that period, not the experience of a real cohort. The calculation of
lxremains the same, but the interpretation is different. -
Abridged Life Table: This type uses broader age intervals to simplify calculations, especially when data are scarce. The calculation of
lxremains similar, but the accuracy might be slightly reduced. -
Complete Life Table: This type uses very narrow age intervals (often one year), providing a more detailed picture of mortality. The calculation of
lxremains the same, but more detailed data is required.
The choice of life table type significantly impacts the interpretation of lx. A cohort life table's lx represents actual survival, whereas a period life table's lx represents a hypothetical cohort's survival based on the period's mortality pattern.
Interpreting lx and its Significance
The lx column provides crucial information about survival patterns:
-
Direct Observation of Survival: It directly shows the number of individuals surviving to a given age. This allows for a clear visualization of mortality trends.
-
Basis for Other Calculations:
lxforms the basis for calculating other important life table statistics, such as life expectancy (ex), death rates, and various other demographic indicators. -
Comparison Across Populations: Comparing
lxvalues across different populations, time periods, or groups allows for the identification of disparities in mortality patterns and potential influencing factors.
Practical Applications and Examples
Life tables and the calculation of lx have numerous applications across diverse fields:
-
Public Health: Monitoring trends in child mortality, assessing the impact of public health interventions, and planning healthcare resource allocation.
-
Actuarial Science: Calculating life insurance premiums, pension benefits, and other actuarial products.
-
Population Studies: Forecasting population growth, analyzing age structures, and understanding population dynamics.
-
Environmental Studies: Examining the impact of environmental factors on mortality rates and life expectancy.
Beyond lx: Other Important Life Table Statistics
While lx is crucial, it's only one piece of the puzzle. Other key statistics derived from a life table include:
-
Mortality Rate (mx): This represents the number of deaths per 1,000 individuals at a given age.
-
Life Expectancy (ex): The average remaining years of life for an individual at a given age.
-
Infant Mortality Rate: The number of deaths of infants under one year of age per 1,000 live births.
-
Child Mortality Rate: The number of deaths of children under five years of age per 1,000 live births.
These statistics, calculated using lx and other life table components, provide a holistic picture of a population's mortality experience and its implications.
Conclusion: Mastering lx Calculations for Powerful Demographic Insights
Calculating lx in a life table is a fundamental skill in demography and related fields. Understanding the underlying principles, methods, and interpretations is crucial for harnessing the power of life tables to analyze mortality patterns, make informed decisions, and gain valuable insights into population dynamics. By mastering this essential technique, researchers and practitioners can effectively contribute to advancements in public health, actuarial science, and various other disciplines. Remember to always consider the type of life table you are working with and ensure that your data are reliable and accurate for meaningful results.
Latest Posts
Latest Posts
-
Internal And External Users Of Accounting
Apr 08, 2025
-
Example Of Linear Programming In Real Life
Apr 08, 2025
-
Where In The Brain Is The Respiratory Center Located
Apr 08, 2025
-
Conditional Statements That Are Always True Are Called
Apr 08, 2025
-
How Many Water Molecules Self Ionize In One Liter Of Water
Apr 08, 2025
Related Post
Thank you for visiting our website which covers about How To Calculate Lx Life Table . We hope the information provided has been useful to you. Feel free to contact us if you have any questions or need further assistance. See you next time and don't miss to bookmark.