How To Draw A Titration Curve
Muz Play
Mar 28, 2025 · 7 min read
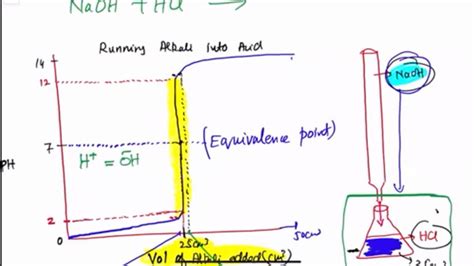
Table of Contents
How to Draw a Titration Curve: A Comprehensive Guide
Titration curves are graphical representations of the change in pH or other relevant property of a solution as a titrant is added. They're essential tools in analytical chemistry, providing valuable insights into the stoichiometry and equilibrium constants of acid-base reactions. Mastering the art of drawing and interpreting these curves is crucial for students and professionals alike. This comprehensive guide will equip you with the knowledge and skills to confidently draw accurate and informative titration curves.
Understanding the Fundamentals of Titration
Before diving into the drawing process, let's solidify our understanding of the underlying principles. Titration involves the gradual addition of a solution of known concentration (the titrant) to a solution of unknown concentration (the analyte) until the reaction between them is complete. The point at which this occurs is called the equivalence point. This point is often visually indicated by a change in color using an indicator, which changes color at or near the equivalence point. In reality, we observe the end point, which is the point at which the indicator changes color, representing an approximation of the equivalence point.
Key Concepts:
-
Strong Acid-Strong Base Titration: Involves the reaction between a strong acid (like HCl) and a strong base (like NaOH). The resulting titration curve is relatively symmetrical, with a sharp pH change near the equivalence point.
-
Weak Acid-Strong Base Titration: This involves the reaction between a weak acid (like acetic acid) and a strong base. The curve is less steep near the equivalence point, and the pH at the equivalence point will be above 7 (alkaline). The presence of a buffer region is a characteristic feature.
-
Strong Acid-Weak Base Titration: This is the reverse of the previous case. The curve will be less steep near the equivalence point, and the pH at the equivalence point will be below 7 (acidic).
-
Weak Acid-Weak Base Titration: This type of titration is more complex and doesn't usually produce a sharp change in pH near the equivalence point, making accurate determination of the equivalence point challenging.
-
pH: A measure of the acidity or basicity of a solution. A pH of 7 is neutral; below 7 is acidic, and above 7 is basic (alkaline).
-
pKa: The negative logarithm of the acid dissociation constant (Ka). It indicates the strength of a weak acid; a lower pKa value indicates a stronger acid.
Step-by-Step Guide to Drawing a Titration Curve
Drawing a titration curve requires a systematic approach. We'll outline the process for a strong acid-strong base titration, then discuss modifications for other scenarios.
1. Gather Necessary Information:
- Concentration of the titrant (M): This is the molarity of the solution being added from the burette.
- Volume of the analyte (V): This is the initial volume of the solution being titrated in the flask.
- Concentration of the analyte (M): This is usually unknown and determined through the titration. (For practice examples, this will be given).
- Balanced Chemical Equation: This is critical for determining the stoichiometry of the reaction. For example, for a strong acid-strong base titration: HCl(aq) + NaOH(aq) → NaCl(aq) + H₂O(l)
- Type of Acid and Base: This determines the overall shape and characteristics of the curve.
2. Calculate the Equivalence Point Volume:
This is the volume of titrant needed to completely neutralize the analyte. Use the stoichiometry from the balanced chemical equation and the known concentrations to calculate this.
For example, in the HCl-NaOH titration:
Moles of HCl = Molarity of HCl x Volume of HCl Moles of NaOH = Moles of HCl (at the equivalence point) Volume of NaOH (at equivalence point) = Moles of NaOH / Molarity of NaOH
3. Create a Table of Data Points:
Construct a table with columns for:
- Volume of titrant added (mL): Start with 0 mL and incrementally add small volumes, particularly near the equivalence point.
- Moles of titrant added: Calculate this for each increment using the titrant's molarity and added volume.
- Moles of analyte remaining: Use the stoichiometry to calculate the remaining moles of analyte after each addition.
- Concentration of H+ or OH- ions: Calculate this based on the remaining moles of acid or base and the total volume of the solution.
- pH: Calculate the pH using the concentration of H+ ions (pH = -log[H+]) or OH- ions (pOH = -log[OH-], then pH = 14 - pOH).
4. Plot the Data:
Plot the pH (y-axis) against the volume of titrant added (x-axis). The resulting curve represents the titration curve.
5. Identify Key Features:
- Equivalence Point: The point on the curve where the pH changes most dramatically. This corresponds to the complete neutralization of the analyte.
- Half-Equivalence Point: The point at which half of the analyte has been neutralized. For weak acid-strong base titrations, the pH at this point equals the pKa of the weak acid.
- Buffer Region: For weak acid-strong base or weak base-strong acid titrations, this is the relatively flat region before the equivalence point where the solution acts as a buffer.
Modifications for Different Titration Types
Weak Acid-Strong Base Titration
The procedure remains similar, but there are crucial differences:
- pH Calculation: The calculation of pH becomes more complex as it involves considering the equilibrium of the weak acid. The Henderson-Hasselbalch equation is often employed.
- Buffer Region: A significant buffer region will be observed before the equivalence point.
- Equivalence Point pH: The pH at the equivalence point will be greater than 7 (basic) due to the presence of the conjugate base.
Strong Acid-Weak Base Titration
Again, the general procedure remains the same, but:
- pH Calculation: Similar considerations as for weak acid-strong base titrations apply.
- Equivalence Point pH: The pH at the equivalence point will be less than 7 (acidic) due to the presence of the conjugate acid.
Weak Acid-Weak Base Titration
This is the most challenging case due to the lack of a sharp change in pH around the equivalence point. Accurate determination of the equivalence point becomes very difficult without sophisticated techniques.
Tips for Accurate Curve Drawing
- Use Graph Paper or Software: Accurate plotting is crucial for interpretation.
- Choose Appropriate Scales: Select scales for both axes that allow for a clear presentation of the data.
- Label Axes and Data Points: Clear labeling ensures readability and understanding.
- Pay Attention to Significant Figures: Maintain consistency in significant figures throughout the calculations.
- Practice Makes Perfect: The more titration curves you draw, the better your understanding and skill will become.
Advanced Applications and Considerations
Titration curves are not just for simple acid-base reactions. They're used in various applications, including:
- Determination of unknown concentrations: A primary use of titration.
- Studying equilibrium constants: Analyzing the curve provides insights into the Ka or Kb values.
- Monitoring reaction progress: Observing changes in pH can indicate reaction completion.
- Complexometric titrations: Titration involving the formation of coordination complexes.
- Redox titrations: Titration based on oxidation-reduction reactions.
Beyond these core applications, several sophisticated methods and considerations exist to refine titration analysis, including derivative plots to identify the equivalence point more precisely and the incorporation of statistical analysis to account for uncertainties in measurements.
Conclusion
Drawing a titration curve is a valuable skill in analytical chemistry. By understanding the fundamentals of titration, following the step-by-step guide, and adapting the procedure to various titration types, you'll be equipped to confidently generate and interpret these essential graphical representations. Remember that practice is key to mastering this skill, leading to improved accuracy and a deeper understanding of acid-base chemistry and analytical techniques. Through diligent practice and application of the principles outlined, you will become adept at extracting valuable insights from titration curves. This skill is not just useful in academic settings, it is also crucial for various professional applications requiring precise chemical analysis.
Latest Posts
Latest Posts
-
What Is The Chemical Equation For Aerobic Respiration
Mar 31, 2025
-
Equation Of The Tangent Line Implicit Differentiation
Mar 31, 2025
-
What Is The Secondary Structure Of Dna
Mar 31, 2025
-
Is Water An Ionic Or Covalent Bond
Mar 31, 2025
-
Why Would A Beta Sheet Not Have Alternating Polar Nonpolar Aa
Mar 31, 2025
Related Post
Thank you for visiting our website which covers about How To Draw A Titration Curve . We hope the information provided has been useful to you. Feel free to contact us if you have any questions or need further assistance. See you next time and don't miss to bookmark.
