How To Find The Km Of The Inhibited Enzyme
Muz Play
Mar 18, 2025 · 7 min read
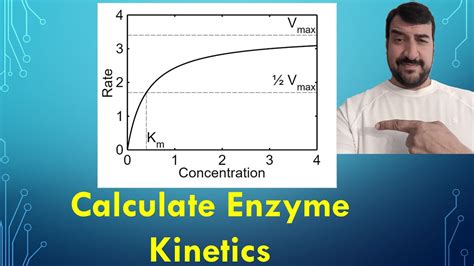
Table of Contents
How to Find the K<sub>m</sub> of an Inhibited Enzyme
Determining the Michaelis-Menten constant (K<sub>m</sub>) for an enzyme in the presence of an inhibitor is crucial for understanding the mechanism of inhibition and the potency of the inhibitor. K<sub>m</sub>, representing the substrate concentration at half-maximal velocity (V<sub>max</sub>/2), reflects the enzyme's affinity for its substrate. Inhibition alters this relationship, and the method for determining K<sub>m</sub> needs adjustment accordingly. This comprehensive guide will walk you through the process, covering various inhibition types and analytical approaches.
Understanding Enzyme Kinetics and Inhibition
Before delving into the methods, a solid understanding of basic enzyme kinetics and inhibition types is essential.
Michaelis-Menten Kinetics
The Michaelis-Menten equation describes the relationship between the initial reaction velocity (v<sub>0</sub>) and substrate concentration ([S]):
v<sub>0</sub> = V<sub>max</sub>[S] / (K<sub>m</sub> + [S])
Where:
- v<sub>0</sub>: Initial reaction velocity
- V<sub>max</sub>: Maximum reaction velocity
- K<sub>m</sub>: Michaelis constant (substrate concentration at V<sub>max</sub>/2)
- [S]: Substrate concentration
A low K<sub>m</sub> value indicates high substrate affinity, while a high K<sub>m</sub> suggests low affinity.
Types of Enzyme Inhibition
Several types of enzyme inhibition exist, each affecting the K<sub>m</sub> and V<sub>max</sub> differently:
-
Competitive Inhibition: The inhibitor competes with the substrate for binding to the enzyme's active site. It increases the apparent K<sub>m</sub> (lowering affinity) but does not affect V<sub>max</sub>.
-
Uncompetitive Inhibition: The inhibitor binds only to the enzyme-substrate complex. It decreases both the apparent K<sub>m</sub> (increasing affinity) and V<sub>max</sub>.
-
Non-competitive Inhibition: The inhibitor binds to a site other than the active site, affecting both the enzyme and the enzyme-substrate complex. It decreases V<sub>max</sub> but does not affect K<sub>m</sub>.
-
Mixed Inhibition: The inhibitor binds to both the enzyme and the enzyme-substrate complex, with different affinities. This leads to changes in both K<sub>m</sub> and V<sub>max</sub>. The changes depend on the relative affinities of the inhibitor for the enzyme and the enzyme-substrate complex.
Methods for Determining K<sub>m</sub> in the Presence of an Inhibitor
Several methods can be employed to determine K<sub>m</sub> in the presence of an inhibitor. The choice depends on the type of inhibition and the available resources.
1. Graphical Methods: Lineweaver-Burk Plot
The Lineweaver-Burk plot, a double reciprocal plot of the Michaelis-Menten equation (1/v<sub>0</sub> vs. 1/[S]), is a common method for determining K<sub>m</sub> and V<sub>max</sub>.
1/v<sub>0</sub> = (K<sub>m</sub>/V<sub>max</sub>)(1/[S]) + 1/V<sub>max</sub>
The x-intercept is -1/K<sub>m</sub>, and the y-intercept is 1/V<sub>max</sub>. In the presence of an inhibitor, multiple lines are plotted for different inhibitor concentrations. The type of inhibition can be identified by analyzing the intercepts and slopes:
-
Competitive Inhibition: Lines intersect on the y-axis (same V<sub>max</sub>, different K<sub>m</sub>).
-
Uncompetitive Inhibition: Lines are parallel (different V<sub>max</sub> and K<sub>m</sub>, but the ratio remains constant).
-
Non-competitive Inhibition: Lines intersect on the x-axis (same K<sub>m</sub>, different V<sub>max</sub>).
-
Mixed Inhibition: Lines intersect at a point neither on the x nor y axis (different V<sub>max</sub> and K<sub>m</sub>).
Limitations of Lineweaver-Burk Plot: This method is sensitive to errors in data points, particularly at low substrate concentrations. Points with high 1/v<sub>0</sub> values have a larger impact on the plot's slope and intercepts.
2. Graphical Methods: Eadie-Hofstee Plot
The Eadie-Hofstee plot is an alternative graphical method, plotting v<sub>0</sub>/[S] against v<sub>0</sub>.
v<sub>0</sub>/[S] = -K<sub>m</sub>(v<sub>0</sub>/V<sub>max</sub>) + V<sub>max</sub>/K<sub>m</sub>
The slope is -K<sub>m</sub>, and the y-intercept is V<sub>max</sub>/K<sub>m</sub>. This plot is generally less sensitive to errors than the Lineweaver-Burk plot.
3. Graphical Methods: Hanes-Woolf Plot
The Hanes-Woolf plot, plotting [S]/v<sub>0</sub> against [S], offers another perspective.
[S]/v<sub>0</sub> = (K<sub>m</sub>/V<sub>max</sub>)[S] + 1/V<sub>max</sub>
The slope is K<sub>m</sub>/V<sub>max</sub>, and the y-intercept is 1/V<sub>max</sub>. Like the Eadie-Hofstee plot, it's often preferred over the Lineweaver-Burk plot due to its lower sensitivity to errors.
4. Non-linear Regression Analysis
Non-linear regression analysis directly fits the Michaelis-Menten equation to the experimental data without linear transformation. This is generally the most accurate method, minimizing errors associated with linearization. Software packages like GraphPad Prism, OriginPro, or R can perform this analysis. This method allows for the determination of K<sub>m</sub> and V<sub>max</sub> with their corresponding confidence intervals, providing a more robust statistical evaluation of the results.
Advantages of Non-linear Regression: This method is less susceptible to errors in data points, especially at low and high substrate concentrations. It provides accurate estimates of K<sub>m</sub> and V<sub>max</sub> with their associated confidence intervals.
Note: For all graphical methods and non-linear regression analysis, multiple experiments are essential for accurate K<sub>m</sub> determination. The data should be averaged and standard deviations or standard errors should be calculated to reflect the variability in measurements.
Analyzing the Data: Interpreting the Results
Once you have determined the K<sub>m</sub> values in the presence and absence of inhibitors, analyze the changes to determine the type of inhibition. Remember to account for experimental error and use statistical analysis to determine if the observed differences are significant.
-
Competitive Inhibition: K<sub>m</sub> increases, V<sub>max</sub> remains constant.
-
Uncompetitive Inhibition: Both K<sub>m</sub> and V<sub>max</sub> decrease, but the ratio K<sub>m</sub>/V<sub>max</sub> remains constant.
-
Non-competitive Inhibition: V<sub>max</sub> decreases, K<sub>m</sub> remains constant.
-
Mixed Inhibition: Both K<sub>m</sub> and V<sub>max</sub> change.
Experimental Considerations
Accurate determination of K<sub>m</sub> requires meticulous experimental design and execution.
1. Substrate Concentration Range:
Use a wide range of substrate concentrations, spanning several orders of magnitude, to ensure sufficient data points for accurate curve fitting. Include both low and high substrate concentrations to capture the full range of the enzyme's activity.
2. Enzyme Concentration:
Maintain a constant, low enzyme concentration to ensure that the reaction is following first-order kinetics. This simplifies data analysis and prevents complications due to substrate depletion.
3. Inhibitor Concentration:
Use different inhibitor concentrations to observe their effect on the enzyme kinetics. This allows you to assess the inhibitor's potency (e.g., IC<sub>50</sub>) and its mechanism of action.
4. Control Experiments:
Always include control experiments without the inhibitor to establish the baseline K<sub>m</sub> and V<sub>max</sub> values for comparison. Ensure appropriate controls are used to account for non-enzymatic reactions or background interference.
5. Temperature and pH:
Control the temperature and pH throughout the experiment to maintain consistent reaction conditions. This helps to ensure reproducible results and prevents any unwanted effects on enzyme activity.
6. Data Analysis Software:
Use appropriate data analysis software to fit the experimental data to the Michaelis-Menten equation and determine the kinetic parameters.
Conclusion
Determining the K<sub>m</sub> of an inhibited enzyme requires a thorough understanding of enzyme kinetics, inhibition mechanisms, and appropriate analytical techniques. While graphical methods like the Lineweaver-Burk plot offer a visual representation, non-linear regression analysis offers superior accuracy and robustness. Rigorous experimental design and meticulous data analysis are crucial for obtaining reliable and meaningful results. By accurately determining the K<sub>m</sub>, researchers gain valuable insights into enzyme function and inhibitor potency, enabling the development of more effective enzyme-based therapies and tools. Remember that the choice of method will ultimately depend on the specific situation and the resources available. However, the careful consideration of all the factors mentioned above will greatly enhance the accuracy and reliability of your results.
Latest Posts
Latest Posts
-
Shear Force And Bending Moment Diagram For Cantilever Beam
Mar 18, 2025
-
What Is The Percentage Of Truth In A Joke
Mar 18, 2025
-
T Test Formula For Dependent Samples
Mar 18, 2025
-
Eriksons Stage Of Integrity Vs Despair
Mar 18, 2025
-
What Is The Difference Between Microscopic And Macroscopic
Mar 18, 2025
Related Post
Thank you for visiting our website which covers about How To Find The Km Of The Inhibited Enzyme . We hope the information provided has been useful to you. Feel free to contact us if you have any questions or need further assistance. See you next time and don't miss to bookmark.
