If Mean Is Greater Than Median
Muz Play
Mar 31, 2025 · 5 min read
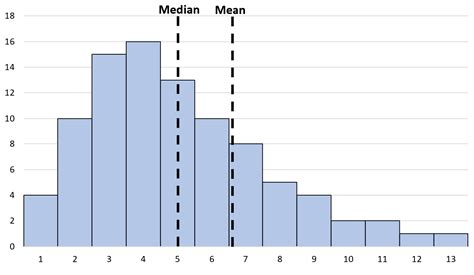
Table of Contents
If the Mean is Greater Than the Median: Understanding Right-Skewed Distributions
The relationship between the mean and the median of a dataset provides valuable insights into its underlying distribution. While often used interchangeably in casual conversation, the mean (average) and median (middle value) can differ significantly, revealing crucial information about the data's symmetry and the presence of outliers or extreme values. This article delves deep into the implications of a mean exceeding the median, explaining the underlying statistical principles and providing practical examples across various fields.
Understanding Mean and Median
Before exploring the scenarios where the mean surpasses the median, let's solidify our understanding of these two fundamental statistical measures:
Mean: Calculated by summing all values in a dataset and dividing by the total number of values. It's sensitive to outliers; a single extreme value can significantly impact the mean.
Median: The middle value in a sorted dataset. If the dataset has an even number of values, the median is the average of the two middle values. It's less susceptible to outliers than the mean.
The Significance of Mean > Median
When the mean is greater than the median, it indicates a right-skewed distribution. This means the data is concentrated towards the lower end of the scale, with a long tail extending towards the higher values. This tail contains a relatively small number of exceptionally large values that pull the mean upwards, while the median remains relatively unaffected by these extremes.
Visualizing Right Skewness: Imagine a histogram representing the data. A right-skewed distribution would appear with a longer tail on the right side, indicating a higher concentration of data points on the left, and a few outliers pulling the mean to the right.
Causes of Right-Skewed Distributions
Several factors can contribute to a right-skewed distribution:
1. Outliers: The presence of a few extremely high values is the most common cause. These outliers disproportionately affect the mean, pulling it upwards while leaving the median largely unchanged.
2. Natural Constraints: In some real-world scenarios, there's a natural lower bound but no upper bound. For example, income distribution often exhibits right skewness because there's a lower limit of zero income, but no upper limit to how much someone can earn. A few high-income earners significantly influence the mean.
3. Measurement Scales: The choice of measurement scale can influence skewness. For instance, using a logarithmic scale can transform a right-skewed distribution into a more symmetrical one.
4. Data Collection Bias: Systematic biases in data collection can also lead to right skewness. For instance, if a survey disproportionately samples individuals with higher values, the resulting dataset will likely be right-skewed.
Examples of Mean > Median in Real-World Data
Let's illustrate the concept with several practical examples:
1. Income Distribution: As mentioned earlier, income distribution in most countries exhibits right skewness. The vast majority of people earn moderate incomes, while a small percentage of high earners significantly inflate the mean income. The median income provides a more representative measure of the "typical" income.
2. House Prices: In a city with a mix of affordable and luxury housing, house prices often exhibit right skewness. A few extremely expensive properties can significantly raise the mean price, while the median price represents a more typical value.
3. Company Sizes: The distribution of company sizes (measured by revenue or number of employees) frequently shows right skewness. A small number of very large corporations significantly influence the mean size, while the median size better reflects the typical company size.
4. Test Scores: In a challenging exam, the scores might exhibit right skewness. Most students achieve average scores, while a few exceptional students attain very high scores, pulling up the mean score.
5. Asset Values: The values of assets like stocks or real estate often display right skewness due to the possibility of substantial gains for a few while others experience moderate returns or losses.
Implications and Interpretations
Understanding that the mean is greater than the median signifies a right-skewed distribution is crucial for several reasons:
-
Data Interpretation: It warns against using the mean as the sole representative measure of central tendency. The median provides a more robust measure in the presence of outliers.
-
Model Selection: Statistical models that assume a normal distribution might not be appropriate for right-skewed data. Using transformations or alternative models designed for skewed data might be necessary.
-
Decision Making: In fields like finance or economics, where decisions are based on data analysis, understanding the skewness is critical to avoid misleading interpretations and make informed decisions.
Addressing Right Skewness
Several techniques can be used to address right skewness in data:
-
Data Transformation: Applying logarithmic, square root, or other transformations can often reduce skewness and make the data more suitable for analysis using standard statistical methods.
-
Robust Statistical Methods: Employing robust statistical methods that are less sensitive to outliers, such as trimmed means or median-based measures, can provide more reliable results.
-
Non-parametric Methods: Considering non-parametric methods, which do not make assumptions about the underlying data distribution, can be beneficial.
Conclusion
The observation that the mean is greater than the median is a strong indicator of right skewness in a dataset. This insight is critical for accurate data interpretation, appropriate model selection, and informed decision-making across various disciplines. By understanding the causes and implications of right-skewness, analysts can choose appropriate statistical tools and avoid potentially misleading conclusions based on the mean alone. Remember to always consider the distribution of your data and choose the most appropriate measure of central tendency based on its characteristics. The median, being less sensitive to outliers, often serves as a more robust measure of central tendency in right-skewed distributions. Careful consideration of both the mean and median provides a more complete and accurate picture of the data.
Latest Posts
Latest Posts
-
Three Factors That Affect Enzyme Activity
Apr 01, 2025
-
Convert The Rectangular Coordinates To Polar Coordinates
Apr 01, 2025
-
How Has Media Changed Over Time
Apr 01, 2025
-
The Most Complex Level Of The Human Body Is The
Apr 01, 2025
-
The Genes Assort Independently
Apr 01, 2025
Related Post
Thank you for visiting our website which covers about If Mean Is Greater Than Median . We hope the information provided has been useful to you. Feel free to contact us if you have any questions or need further assistance. See you next time and don't miss to bookmark.
