Interval Estimate Calculator For Difference In Population Proportions
Muz Play
Mar 18, 2025 · 6 min read
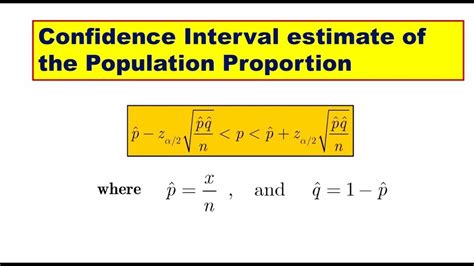
Table of Contents
Interval Estimate Calculator for Difference in Population Proportions: A Comprehensive Guide
Understanding the difference between two population proportions is crucial in many fields, from A/B testing in marketing to clinical trials in medicine. Instead of simply comparing point estimates (like the difference in sample proportions), a more robust approach involves constructing a confidence interval. This interval provides a range of plausible values for the true difference in population proportions, giving a much clearer picture of the uncertainty involved. This article will delve deep into the concept of calculating a confidence interval for the difference in population proportions, explain the underlying assumptions, and guide you through the process using both manual calculations and the interpretation of results from an interval estimate calculator.
Understanding Population Proportions and Their Differences
Before diving into the intricacies of interval estimation, let's clarify some fundamental concepts.
-
Population Proportion (p): This refers to the proportion of individuals in a population possessing a specific characteristic. For example, the proportion of voters who support a particular candidate, or the proportion of patients who respond positively to a new drug.
-
Sample Proportion (p̂): This is an estimate of the population proportion, calculated from a sample drawn from the population.
-
Difference in Population Proportions (p₁ - p₂): This represents the difference between the proportions of a specific characteristic in two distinct populations. For instance, the difference in the proportion of men versus women who prefer a certain brand.
Constructing the Confidence Interval
The confidence interval for the difference in population proportions is calculated using the following formula:
(p̂₁ - p̂₂) ± Z * √[(p̂₁(1-p̂₁)/n₁) + (p̂₂(1-p̂₂)/n₂)]
Where:
- p̂₁ and p̂₂: Sample proportions from population 1 and population 2, respectively.
- n₁ and n₂: Sample sizes from population 1 and population 2, respectively.
- Z: The Z-score corresponding to the desired confidence level (e.g., 1.96 for a 95% confidence level).
This formula essentially combines the standard errors of the two sample proportions to create a margin of error around the observed difference in sample proportions. The resulting interval provides a range within which we are confident the true difference in population proportions lies.
Choosing the Right Z-Score
The Z-score is crucial in determining the width of the confidence interval. A higher confidence level (e.g., 99%) results in a wider interval, reflecting greater uncertainty. Conversely, a lower confidence level (e.g., 90%) leads to a narrower interval, but with reduced confidence. Here's a table showing common Z-scores for various confidence levels:
| Confidence Level | Z-score |
|---|---|
| 90% | 1.645 |
| 95% | 1.96 |
| 99% | 2.576 |
Assumptions of the Confidence Interval
The validity of the confidence interval relies on several assumptions:
-
Random Sampling: Both samples must be randomly selected from their respective populations. This ensures the samples are representative and unbiased.
-
Independence: Observations within each sample must be independent. This means the outcome for one individual should not influence the outcome for another.
-
Sample Size: Both sample sizes (n₁ and n₂) should be large enough to ensure the sampling distribution of the difference in sample proportions is approximately normal. A common rule of thumb is that np̂ ≥ 10 and n(1-p̂) ≥ 10 for both samples. This ensures the use of the normal approximation is valid.
-
Population Independence: The two populations should be independent of each other. The characteristics of one population shouldn't influence the characteristics of the other.
Manual Calculation Example
Let's illustrate the calculation with an example. Suppose we want to compare the effectiveness of two marketing campaigns.
Campaign A: Sample size (n₁) = 1000, Number of conversions (x₁) = 200, Sample proportion (p̂₁) = 200/1000 = 0.2
Campaign B: Sample size (n₂) = 800, Number of conversions (x₂) = 150, Sample proportion (p̂₂) = 150/800 = 0.1875
We want to construct a 95% confidence interval for the difference in conversion rates (p₁ - p₂).
-
Calculate the difference in sample proportions: p̂₁ - p̂₂ = 0.2 - 0.1875 = 0.0125
-
Calculate the standard error: √[(0.2(1-0.2)/1000) + (0.1875(1-0.1875)/800)] ≈ 0.0165
-
Determine the Z-score: For a 95% confidence level, Z = 1.96
-
Calculate the margin of error: 1.96 * 0.0165 ≈ 0.0323
-
Construct the confidence interval: 0.0125 ± 0.0323 = (-0.0198, 0.0448)
Therefore, we are 95% confident that the true difference in conversion rates between Campaign A and Campaign B lies between -1.98% and 4.48%. Since the interval includes 0, we cannot conclusively say there is a significant difference between the two campaigns.
Using an Interval Estimate Calculator
While manual calculations are useful for understanding the underlying principles, using an interval estimate calculator significantly streamlines the process. These calculators automate the steps, reducing the risk of errors and saving time. Simply input the sample proportions, sample sizes, and desired confidence level, and the calculator will output the confidence interval.
Interpreting the Results
The output of an interval estimate calculator typically includes:
-
The confidence interval: The range of plausible values for the difference in population proportions.
-
The point estimate: The observed difference in sample proportions.
-
The margin of error: The width of the confidence interval divided by 2.
-
The confidence level: The probability that the true difference in population proportions lies within the calculated interval.
Interpreting the Significance
Interpreting the confidence interval is critical. If the interval includes zero, it suggests there's no statistically significant difference between the two population proportions. However, if the interval lies entirely above or below zero, it indicates a statistically significant difference, suggesting one population proportion is likely larger than the other. The magnitude of the difference, as reflected in the interval, is also important for practical interpretation. A small difference, even if statistically significant, may not hold practical relevance.
Advanced Considerations
-
Small Sample Sizes: When sample sizes are small, the normal approximation may not be accurate. In such cases, alternative methods, like the exact method based on the binomial distribution, may be necessary.
-
Unequal Variances: If the variances of the two populations are believed to be unequal, adjustments to the standard error calculation might be required. This is a more complex scenario that usually requires specialized statistical software.
-
Hypothesis Testing: The confidence interval can be used to perform a hypothesis test. If the null hypothesis (no difference between proportions) is included within the confidence interval, the null hypothesis is not rejected.
Conclusion
Calculating a confidence interval for the difference in population proportions is a powerful statistical technique. It provides a more nuanced and informative analysis than simply comparing point estimates. While manual calculation provides a deeper understanding, utilizing an interval estimate calculator simplifies the process, making it accessible to a wider audience. Remember always to consider the assumptions underlying the calculation and interpret the results carefully, taking both statistical significance and practical implications into account. By mastering this technique, you can gain valuable insights from comparative studies across numerous fields. Understanding the nuances of confidence intervals and their application helps in making more informed and data-driven decisions.
Latest Posts
Latest Posts
-
What Are The Three Components Of An Rna Nucleotide
Mar 18, 2025
-
Does The Hydrogen Molecule Obey The Octet Rule
Mar 18, 2025
-
How Is Atp Made During Fermentation
Mar 18, 2025
-
Is Main A Keyword In Fortran
Mar 18, 2025
-
How To Find Bond Dissociation Energy
Mar 18, 2025
Related Post
Thank you for visiting our website which covers about Interval Estimate Calculator For Difference In Population Proportions . We hope the information provided has been useful to you. Feel free to contact us if you have any questions or need further assistance. See you next time and don't miss to bookmark.
