Lab Report For Acid Base Titration
Muz Play
Mar 20, 2025 · 7 min read
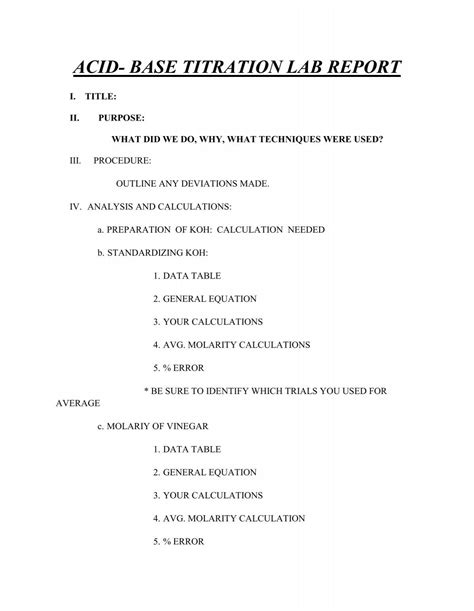
Table of Contents
The Comprehensive Guide to Writing a Perfect Lab Report for Acid-Base Titration
Acid-base titrations are a fundamental technique in chemistry, used to determine the concentration of an unknown solution (analyte) by reacting it with a solution of known concentration (titrant). Mastering this technique and effectively communicating your results through a well-written lab report is crucial for success in chemistry courses and beyond. This guide provides a comprehensive walkthrough of writing a top-notch lab report for an acid-base titration experiment.
I. Understanding the Fundamentals of Acid-Base Titration
Before delving into the report itself, let's solidify our understanding of the core concepts:
A. What is Titration?
Titration is a quantitative analytical technique where a solution of known concentration (the titrant) is gradually added to a solution of unknown concentration (the analyte) until the reaction between them is complete. This point of completion is called the equivalence point.
B. Types of Acid-Base Titrations:
Several types of acid-base titrations exist, depending on the strength of the acid and base involved:
- Strong Acid-Strong Base Titration: This involves reacting a strong acid (e.g., HCl) with a strong base (e.g., NaOH). The equivalence point occurs at pH 7.
- Weak Acid-Strong Base Titration: This involves reacting a weak acid (e.g., CH₃COOH) with a strong base (e.g., NaOH). The equivalence point will be above pH 7.
- Strong Acid-Weak Base Titration: This involves reacting a strong acid (e.g., HCl) with a weak base (e.g., NH₃). The equivalence point will be below pH 7.
- Weak Acid-Weak Base Titration: This type of titration is less common due to the difficulty in determining the equivalence point accurately.
C. Indicators and the End Point:
An indicator is a substance that changes color near the equivalence point, signaling the end of the titration. The end point is the point at which the indicator changes color, ideally very close to the equivalence point. The choice of indicator depends on the pH at the equivalence point. For example, phenolphthalein is a common indicator for strong acid-strong base titrations, changing color around pH 8.2-10.0.
II. Structure of a Lab Report for Acid-Base Titration
A well-structured lab report follows a consistent format, enabling clear and concise communication of your experimental findings. Here's a breakdown of the key sections:
A. Title:
The title should be concise and informative, clearly stating the purpose of the experiment. For example: "Determination of the Concentration of an Unknown Hydrochloric Acid Solution via Titration with Sodium Hydroxide."
B. Abstract:
The abstract provides a brief summary of the entire report. It should include:
- The purpose of the experiment: What was the goal?
- The methods used: Briefly describe the titration procedure.
- The key results: State the calculated concentration of the unknown solution.
- The main conclusions: Were the results accurate? What sources of error were identified?
Keep the abstract concise, usually within 150-200 words.
C. Introduction:
This section provides background information on acid-base titrations. It should include:
- Definition and principles of acid-base titrations: Explain the underlying chemical reactions.
- Relevance of the experiment: Why is this technique important?
- Specific objectives: Clearly state the aims of the experiment. This might include determining the concentration of an unknown acid or base, verifying the stoichiometry of a reaction, or comparing the strengths of different acids or bases.
D. Materials and Methods:
This section provides a detailed description of the materials used and the procedures followed. Be precise and thorough:
- Materials: List all chemicals and equipment used, including their concentrations and specifications.
- Procedure: Provide a step-by-step description of the titration process. This should be detailed enough for someone else to replicate your experiment. Include specific details about the preparation of solutions, the titration technique used (e.g., direct titration, back titration), the volume measurements, and the use of the indicator. Consider using numbered steps for clarity.
E. Results:
This section presents your experimental data in a clear and organized manner. This usually includes:
- Data Tables: Organize your raw data in tables, clearly labeling all columns and rows. Include units for all measurements. Typical data would include the initial and final burette readings, the volume of titrant used, and any other relevant observations.
- Graphs: Create appropriate graphs to visually represent your data. For example, a titration curve showing the pH change as a function of the volume of titrant added can provide valuable insights. Ensure your graphs are properly labeled with titles, axis labels, and units.
- Calculations: Show all calculations performed, including the calculation of the concentration of the unknown solution. Clearly explain the formulas and steps used. Include sample calculations, and clearly show the units at every step.
F. Discussion:
This is a crucial section where you analyze your results, interpret their meaning, and address potential sources of error. Include:
- Analysis of Results: Discuss the trends and patterns observed in your data. Compare your calculated concentration of the unknown solution to any known or expected values. Calculate the percent error.
- Interpretation of Results: Explain the significance of your findings in the context of the experiment's objectives. What conclusions can you draw from your results?
- Sources of Error: Identify and discuss potential sources of error in your experiment. These could include:
- Systematic errors: Errors that consistently affect the results in one direction (e.g., improperly calibrated equipment).
- Random errors: Errors that are unpredictable and can vary in magnitude and direction (e.g., variations in reading the burette).
- Suggestions for Improvement: Based on your analysis of sources of error, suggest ways to improve the experimental design or procedure to minimize errors in future experiments.
G. Conclusion:
Summarize the main findings and conclusions of your experiment. Restate your calculated concentration of the unknown solution and discuss whether your results support your hypotheses.
H. References:
List all references cited in your report using a consistent citation style (e.g., APA, MLA).
III. Advanced Considerations and Best Practices
To elevate your lab report beyond a simple recounting of the experiment, consider incorporating these elements:
- Error Analysis: Go beyond simply listing potential errors. Quantify the impact of these errors on your results using statistical methods, where appropriate. Calculate confidence intervals for your calculated concentration.
- Comparison to Literature Values: If available, compare your results to literature values for the concentration of the unknown solution. Discuss any discrepancies.
- Discussion of Indicator Choice: Explain why you chose a specific indicator for your titration. Discuss the limitations of the indicator and how this might affect the accuracy of your results.
- Understanding Titration Curves: Thoroughly analyze your titration curve, identifying key points such as the equivalence point, the half-equivalence point (for weak acid/base titrations), and the buffer region. Use these points to confirm your calculations and gain a deeper understanding of the titration process.
IV. Example Calculations and Data Presentation
Let's consider a hypothetical strong acid-strong base titration. Suppose you titrated an unknown HCl solution with 0.100 M NaOH.
Data Table Example:
| Trial | Initial Burette Reading (mL) | Final Burette Reading (mL) | Volume of NaOH Used (mL) |
|---|---|---|---|
| 1 | 0.00 | 25.50 | 25.50 |
| 2 | 0.00 | 25.45 | 25.45 |
| 3 | 0.00 | 25.55 | 25.55 |
Calculation of Average Volume of NaOH:
Average volume = (25.50 mL + 25.45 mL + 25.55 mL) / 3 = 25.50 mL
Calculation of Moles of NaOH:
Moles of NaOH = Molarity × Volume (in Liters) = 0.100 mol/L × 0.02550 L = 0.00255 mol
Calculation of Moles of HCl (assuming a 1:1 mole ratio):
Moles of HCl = Moles of NaOH = 0.00255 mol
Calculation of Molarity of HCl (assuming you titrated 25.00 mL of HCl):
Molarity of HCl = Moles of HCl / Volume of HCl (in Liters) = 0.00255 mol / 0.02500 L = 0.102 M
This detailed example showcases how to present your data and perform calculations clearly and concisely. Remember to adapt this structure and content to the specific details of your experiment.
By following this comprehensive guide and applying these best practices, you can craft a high-quality lab report that effectively communicates your experimental results and demonstrates a thorough understanding of acid-base titrations. Remember, clarity, precision, and a logical flow are key to a successful lab report.
Latest Posts
Latest Posts
-
Is Melting Point Physical Or Chemical
Mar 21, 2025
-
Are Oxidation Numbers The Same As Charges
Mar 21, 2025
-
Manifest And Latent Functions Of Education
Mar 21, 2025
-
Issuance Of Common Stock Journal Entry
Mar 21, 2025
-
Is Salt Water A Mixture Or Pure Substance
Mar 21, 2025
Related Post
Thank you for visiting our website which covers about Lab Report For Acid Base Titration . We hope the information provided has been useful to you. Feel free to contact us if you have any questions or need further assistance. See you next time and don't miss to bookmark.
