Label The Features Of The Phase Diagram
Muz Play
Mar 22, 2025 · 6 min read
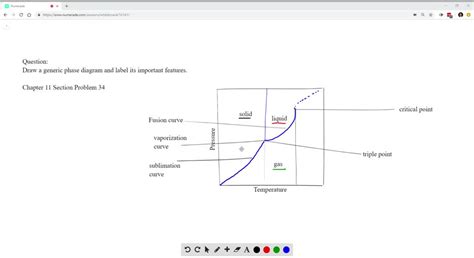
Table of Contents
Labeling the Features of a Phase Diagram: A Comprehensive Guide
Phase diagrams are powerful visual tools used in materials science, chemistry, and engineering to represent the equilibrium relationships between different phases of a substance as a function of temperature, pressure, and composition. Understanding how to label and interpret these diagrams is crucial for predicting material behavior and designing new materials. This comprehensive guide will walk you through the key features of a phase diagram, explaining how to label them correctly and understand their significance.
Understanding the Axes and Basic Components
Before diving into specific features, let's establish the foundation. A typical phase diagram has at least two axes:
-
Temperature (T): Usually plotted on the x-axis or y-axis, depending on the specific diagram's presentation. Temperature represents the average kinetic energy of the particles within the substance. Higher temperatures generally correlate with increased particle movement and phase transitions.
-
Pressure (P): Usually plotted on the y-axis or x-axis, again depending on the diagram. Pressure represents the force exerted per unit area on the substance. Changes in pressure can significantly influence phase equilibria.
For multi-component systems (e.g., alloys or solutions), a third axis representing composition (e.g., weight percent of a specific element) is added. This adds significant complexity but allows for a richer understanding of phase behavior in mixtures.
Key Features of a Phase Diagram: Labeling and Interpretation
Now, let's explore the key features you'll encounter on a phase diagram, along with clear labeling instructions:
1. Phase Regions:
These are areas on the diagram representing the conditions of temperature and pressure (and composition for multi-component systems) under which a specific phase is stable. Label each region clearly with the name of the phase present (e.g., solid, liquid, gas, α-phase, β-phase, etc.).
- Solid Phase Region: This region is usually located at lower temperatures and higher pressures. The solid phase is characterized by a rigid structure with strong intermolecular forces holding the particles in fixed positions.
- Liquid Phase Region: This region is generally found at higher temperatures and lower pressures compared to the solid phase. Liquids have weaker intermolecular forces than solids, resulting in greater particle mobility.
- Gas Phase Region: This region typically occupies the highest temperature and lowest pressure area. Gases are characterized by very weak intermolecular forces and highly mobile particles.
2. Phase Boundaries (or Equilibrium Curves):
These lines separate different phase regions and represent the conditions where two phases coexist in equilibrium. Label each boundary with the phases it separates (e.g., Solid-Liquid, Liquid-Gas, Solid-Gas).
- Solidus Line: The solidus line is the boundary separating the solid phase region from the region where both solid and liquid phases coexist. It represents the temperature at which the last solid melts at a given pressure (or composition).
- Liquidus Line: The liquidus line is the boundary separating the liquid phase region from the region where both solid and liquid phases coexist. It represents the temperature at which the first solid begins to form from the liquid phase at a given pressure (or composition).
- Vapor Pressure Curve (or Vaporization Curve): This curve separates the liquid and gas phases and shows the relationship between temperature and vapor pressure. The vapor pressure increases with temperature.
- Sublimation Curve: This curve separates the solid and gas phases, and it shows the conditions under which a solid directly transitions to a gas without passing through the liquid phase (sublimation).
- Triple Point: This is the unique point where all three phases (solid, liquid, and gas) coexist in equilibrium. Clearly label this point as "Triple Point."
3. Critical Point:
For some substances, the liquid and gas phases become indistinguishable above a critical temperature and pressure. Label this point as "Critical Point." Beyond this point, there is a single supercritical fluid phase.
4. Eutectic Point (for Binary Systems):
In binary phase diagrams (diagrams representing mixtures of two components), the eutectic point represents the lowest temperature at which a liquid phase can exist. At this point, the liquid transforms into two solid phases simultaneously. Label this point as "Eutectic Point" and clearly indicate the composition and temperature.
5. Peritectic Point (for Binary Systems):
Another important point in binary systems, the peritectic point, signifies a reaction where a liquid and a solid phase react at a specific temperature to form a different solid phase. Label this point as "Peritectic Point" and clearly indicate the composition and temperature.
6. Congruent Melting Point (for Binary Systems):
A congruent melting point represents a composition where a solid melts directly into a liquid of the same composition. This contrasts with eutectic points where a single liquid transforms into two different solid phases. Label this point clearly with a description indicating "Congruent Melting Point."
7. Solid Solutions (for Binary Systems):
In binary phase diagrams, the region showing complete solid solubility between two components is identified as a solid solution. These are commonly labeled as α-phase, β-phase, etc., to represent different solid solution regions that have different crystal structures or compositions. Label each solid solution phase clearly with its appropriate designation (e.g., α-phase, β-phase). Often, these regions are described in terms of composition ranges.
8. Intermetallic Compounds (for Binary Systems):
These are distinct stoichiometric compounds formed between the components in a binary system. They have unique crystal structures and compositions and are represented by a vertical line on the composition axis in the phase diagram. Label each intermetallic compound with its chemical formula.
Advanced Features and Considerations
The complexity of phase diagrams increases significantly when dealing with multi-component systems (ternary, quaternary, etc.). These diagrams frequently involve three-dimensional representations or projections onto two-dimensional planes. Labeling these diagrams requires careful attention to detail and a deep understanding of the thermodynamic principles governing phase equilibria.
Practical Applications of Phase Diagrams
Phase diagrams are invaluable tools in many fields:
- Materials Science: Predicting the microstructure and properties of alloys and ceramics based on their processing conditions.
- Metallurgy: Designing alloys with desired properties by controlling their composition and heat treatment.
- Ceramics: Understanding the sintering behavior and phase transformations in ceramic materials.
- Geology: Interpreting the formation and evolution of rocks and minerals.
- Chemical Engineering: Designing separation and purification processes.
Conclusion: Mastering Phase Diagram Interpretation
Successfully labeling and interpreting phase diagrams requires a solid grasp of thermodynamics and phase equilibria. This guide provides a comprehensive overview of the key features, but further study and practice are essential for mastering this valuable skill. By accurately labeling and analyzing these diagrams, scientists and engineers can gain crucial insights into material behavior and utilize this information for a wide variety of applications. Remember to always clearly label all features—axes, phases, boundaries, and critical points—for accurate and effective communication. The clearer your labeling, the easier it will be to understand and utilize the information presented in the phase diagram.
Latest Posts
Latest Posts
-
Is Water An Ionic Or Covalent Compound
Mar 23, 2025
-
Food Chain Of A Killer Whale
Mar 23, 2025
-
World History Culture States And Societies To 1500
Mar 23, 2025
-
Yo Come Una Naranja Ayer Correct Incorrect
Mar 23, 2025
-
Recovery Time Sfter Heat Shock Bacterial Cell
Mar 23, 2025
Related Post
Thank you for visiting our website which covers about Label The Features Of The Phase Diagram . We hope the information provided has been useful to you. Feel free to contact us if you have any questions or need further assistance. See you next time and don't miss to bookmark.
