Lewis Dot Diagram For Ionic Compounds
Muz Play
Mar 30, 2025 · 6 min read
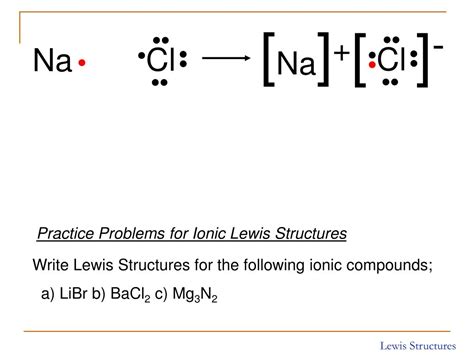
Table of Contents
Lewis Dot Diagrams for Ionic Compounds: A Comprehensive Guide
Lewis dot diagrams, also known as electron dot diagrams, are a simple yet powerful tool for visualizing the valence electrons of atoms and how they participate in chemical bonding. Understanding these diagrams is crucial for comprehending the formation of ionic compounds, where electrons are transferred between atoms to achieve a stable electron configuration. This comprehensive guide will delve deep into the creation and interpretation of Lewis dot diagrams for ionic compounds, exploring various examples and clarifying common misconceptions.
Understanding the Basics: Valence Electrons and the Octet Rule
Before diving into ionic compounds, let's review fundamental concepts. Valence electrons are the electrons located in the outermost shell of an atom. These electrons are the primary participants in chemical bonding. The octet rule states that atoms tend to gain, lose, or share electrons to achieve a stable electron configuration with eight valence electrons, resembling the electron configuration of a noble gas. This stable configuration minimizes their energy and increases their stability. However, it's important to note that the octet rule isn't universally applicable; exceptions exist, particularly for elements beyond the second period.
Identifying Valence Electrons
The number of valence electrons an atom possesses is determined by its group number in the periodic table. For example:
- Group 1 (Alkali Metals): 1 valence electron
- Group 2 (Alkaline Earth Metals): 2 valence electrons
- Group 13 (Boron Group): 3 valence electrons
- Group 14 (Carbon Group): 4 valence electrons
- Group 15 (Pnictogens): 5 valence electrons
- Group 16 (Chalcogens): 6 valence electrons
- Group 17 (Halogens): 7 valence electrons
- Group 18 (Noble Gases): 8 valence electrons (except helium, which has 2)
Constructing Lewis Dot Diagrams for Atoms
To create a Lewis dot diagram for an atom:
- Determine the element's symbol: Write the chemical symbol for the atom in the center.
- Identify the number of valence electrons: Use the periodic table to find the number of valence electrons.
- Represent valence electrons with dots: Place dots around the symbol, representing the valence electrons. Start by placing one dot on each side of the symbol before pairing dots. This visually represents the filling of orbitals.
Example: Let's draw the Lewis dot diagram for oxygen (O). Oxygen is in Group 16, so it has 6 valence electrons. Its Lewis dot diagram would be:
..
:O:
..
Ionic Bonding and Lewis Dot Diagrams
Ionic bonding occurs when one atom transfers one or more valence electrons to another atom. This transfer creates ions: positively charged cations (atoms that have lost electrons) and negatively charged anions (atoms that have gained electrons). The electrostatic attraction between these oppositely charged ions forms the ionic bond.
Illustrating Ionic Bonding with Lewis Dot Diagrams
When depicting ionic bonding using Lewis dot diagrams, follow these steps:
- Draw the Lewis dot diagrams for the individual atoms: Represent each atom involved in the bond with its corresponding Lewis dot structure.
- Identify the electron transfer: Determine which atom will lose electrons (becoming a cation) and which atom will gain electrons (becoming an anion). Generally, metals tend to lose electrons, and nonmetals tend to gain electrons. The transfer is driven by the desire to achieve a stable octet configuration.
- Show electron transfer: Illustrate the transfer of electrons from the metal to the nonmetal using arrows.
- Show resulting ions: Represent the resulting ions with their charges, including the brackets to show the overall charge.
Example: Sodium Chloride (NaCl)
Sodium (Na) is in Group 1 and has one valence electron. Chlorine (Cl) is in Group 17 and has seven valence electrons. Sodium readily loses its one valence electron to achieve a stable configuration, becoming a +1 cation (Na⁺). Chlorine readily gains one electron to complete its octet, becoming a -1 anion (Cl⁻).
Lewis Dot Diagram:
Na• + •Cl: → Na⁺ + [:Cl:]⁻
The resulting ionic compound, sodium chloride, is held together by the strong electrostatic attraction between the positively charged sodium ion and the negatively charged chloride ion.
Examples of Lewis Dot Diagrams for Ionic Compounds
Let's explore more examples, showcasing the diversity of ionic compound formation:
Magnesium Oxide (MgO)
Magnesium (Mg) in Group 2 has two valence electrons, while oxygen (O) in Group 16 has six. Magnesium loses two electrons to become Mg²⁺, and oxygen gains two electrons to become O²⁻.
Lewis Dot Diagram:
Mg•• + :Ö: → Mg²⁺ + [:O:]²⁻
Aluminum Chloride (AlCl₃)
Aluminum (Al) in Group 13 has three valence electrons, while chlorine (Cl) has seven. Aluminum loses three electrons to become Al³⁺, and three chlorine atoms each gain one electron to become Cl⁻.
Lewis Dot Diagram:
Al••• + 3 •Cl: → Al³⁺ + 3 [:Cl:]⁻
Calcium Fluoride (CaF₂)
Calcium (Ca) in Group 2 has two valence electrons, while fluorine (F) in Group 17 has seven. Calcium loses two electrons to become Ca²⁺, and two fluorine atoms each gain one electron to become F⁻.
Lewis Dot Diagram:
Ca•• + 2 •F: → Ca²⁺ + 2 [:F:]⁻
Polyatomic Ions and Lewis Dot Diagrams
Polyatomic ions are groups of atoms that carry an overall charge. Constructing Lewis dot diagrams for compounds containing polyatomic ions involves similar principles. First, draw the Lewis structure for the polyatomic ion, ensuring each atom (except hydrogen) has a full octet or duet. Then show the interaction with the other ion(s) involved.
Example: Ammonium Chloride (NH₄Cl)
Ammonium (NH₄⁺) is a polyatomic cation. Nitrogen shares electrons with four hydrogen atoms, resulting in a +1 charge. Chloride (Cl⁻) is a monatomic anion.
Lewis Dot Diagram (simplified):
[H H:N:H]⁺ + [:Cl:]⁻ → [H H:N:H]⁺[:Cl:]⁻
This simplified diagram shows the overall ionic interaction. A more detailed Lewis structure for NH₄⁺ would illustrate the covalent bonds between nitrogen and hydrogen atoms.
Limitations of Lewis Dot Diagrams
While Lewis dot diagrams provide a valuable visual representation of ionic bonding, they have limitations:
- Simplified Representation: They don't depict the actual three-dimensional structure of molecules.
- Octet Rule Exceptions: Many compounds don't strictly follow the octet rule, especially transition metals and compounds containing elements beyond the second period.
- Bonding Complexity: They don't fully illustrate the nuances of chemical bonding in complex molecules.
Advanced Applications and Further Exploration
Lewis dot diagrams serve as a foundational tool for understanding chemical bonding. While simple, they lay the groundwork for grasping more advanced concepts such as formal charges, resonance structures, and molecular geometry.
Further exploration could involve delving into the relationship between Lewis dot structures and the properties of ionic compounds, such as high melting points, solubility in water, and electrical conductivity in solution. Understanding these relationships helps us comprehend the behavior and application of ionic compounds in various fields.
Conclusion
Lewis dot diagrams are an essential tool for visualizing the electron transfer process in ionic bonding. Mastering their construction and interpretation enhances your understanding of the fundamental principles of chemistry, providing a solid foundation for exploring more complex chemical concepts. By practicing drawing Lewis dot diagrams for a variety of ionic compounds, you'll develop a stronger grasp of chemical bonding and the properties of ionic substances. Remember that practice is key to mastering this crucial skill in chemistry.
Latest Posts
Latest Posts
-
Plant Cell In A Hypotonic Solution
Apr 01, 2025
-
What Is The Definition Of Form In Music
Apr 01, 2025
-
Staph Epidermidis Hemolysis On Blood Agar
Apr 01, 2025
-
Difference Between Autonomic And Somatic Nervous System
Apr 01, 2025
-
Phase Change Properties Of Pure Substances
Apr 01, 2025
Related Post
Thank you for visiting our website which covers about Lewis Dot Diagram For Ionic Compounds . We hope the information provided has been useful to you. Feel free to contact us if you have any questions or need further assistance. See you next time and don't miss to bookmark.
