Lineweaver Burk Plot How To Calculate Vo' Enzyme
Muz Play
Mar 18, 2025 · 6 min read
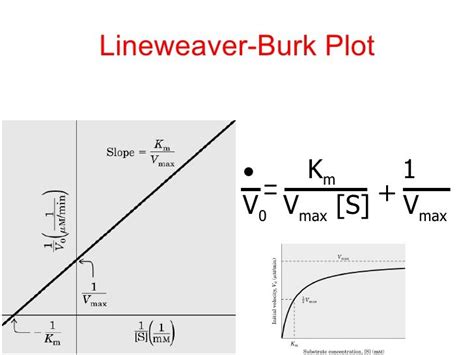
Table of Contents
Lineweaver-Burk Plot: A Comprehensive Guide to Calculating V₀' (Enzyme Kinetics)
Enzyme kinetics is a crucial area of biochemistry that helps us understand how enzymes catalyze reactions and regulate metabolic pathways. A cornerstone of enzyme kinetics analysis is the determination of the enzyme's maximal velocity (V<sub>max</sub>) and Michaelis constant (K<sub>m</sub>). While these parameters can be determined directly from Michaelis-Menten plots, the Lineweaver-Burk plot offers a convenient linear graphical method for their estimation. This comprehensive guide delves into the intricacies of the Lineweaver-Burk plot, explaining its principles, advantages, limitations, and practical applications in calculating V₀', the initial reaction velocity.
Understanding the Michaelis-Menten Equation
Before diving into the Lineweaver-Burk plot, it’s crucial to understand the Michaelis-Menten equation, the foundation upon which it is built. This equation describes the relationship between the initial reaction velocity (V₀) and the substrate concentration ([S]):
V₀ = (V<sub>max</sub>[S]) / (K<sub>m</sub> + [S])
Where:
- V₀: Initial reaction velocity (the rate of product formation at the very beginning of the reaction).
- V<sub>max</sub>: Maximum reaction velocity (the rate when the enzyme is saturated with substrate).
- K<sub>m</sub>: Michaelis constant (substrate concentration at half V<sub>max</sub>; an indicator of enzyme-substrate affinity).
- [S]: Substrate concentration.
The Lineweaver-Burk Plot: Linearizing the Michaelis-Menten Equation
The Michaelis-Menten equation is a hyperbolic curve, making it difficult to accurately determine V<sub>max</sub> and K<sub>m</sub> directly from a graph. The Lineweaver-Burk plot, also known as the double reciprocal plot, linearizes this equation, simplifying the determination of these kinetic parameters. This is achieved by taking the reciprocal of both sides of the Michaelis-Menten equation:
1/V₀ = (K<sub>m</sub> + [S]) / (V<sub>max</sub>[S])
Rearranging this equation further gives the Lineweaver-Burk equation:
1/V₀ = (K<sub>m</sub>/V<sub>max</sub>)(1/[S]) + 1/V<sub>max</sub>
This equation represents a straight line with the form y = mx + c, where:
- y = 1/V₀
- x = 1/[S]
- m (slope) = K<sub>m</sub>/V<sub>max</sub>
- c (y-intercept) = 1/V<sub>max</sub>
How to Construct a Lineweaver-Burk Plot
Constructing a Lineweaver-Burk plot involves these key steps:
-
Conduct Enzyme Assays: Perform several enzyme assays with varying substrate concentrations ([S]). Ensure the initial substrate concentrations are significantly higher than the enzyme concentration to adhere to the Michaelis-Menten assumptions. Accurately measure the initial reaction velocity (V₀) for each substrate concentration.
-
Calculate Reciprocals: Calculate the reciprocals of both V₀ (1/V₀) and [S] (1/[S]) for each data point.
-
Plot the Data: Plot 1/V₀ (on the y-axis) against 1/[S] (on the x-axis). The resulting graph should be a straight line.
-
Determine the Kinetic Parameters:
- V<sub>max</sub>: The negative reciprocal of the y-intercept (where the line crosses the y-axis). That is, V<sub>max</sub> = -1/y-intercept.
- K<sub>m</sub>: The negative ratio of the y-intercept to the slope. That is, K<sub>m</sub> = -slope/y-intercept = Slope x V<sub>max</sub>.
-
Data Analysis and Interpretation: Analyze the quality of the linear fit using a statistical measure like R². A good fit indicates a reliable estimation of kinetic parameters.
Calculating V₀' (Initial Velocity) from the Lineweaver-Burk Plot
While the primary purpose of the Lineweaver-Burk plot is determining V<sub>max</sub> and K<sub>m</sub>, it can also be used to estimate V₀' at any given substrate concentration. To do this:
-
Find the Reciprocal of [S]: Determine the reciprocal of the desired substrate concentration (1/[S]).
-
Locate on the Plot: Locate this value on the x-axis of your Lineweaver-Burk plot.
-
Find the Corresponding 1/V₀: Draw a vertical line from the point on the x-axis until it intersects the plotted line.
-
Calculate V₀': Draw a horizontal line from the point of intersection to the y-axis. The value on the y-axis represents 1/V₀'. Take the reciprocal to obtain V₀'.
This process allows you to predict the initial reaction velocity at any substrate concentration within the range used to construct the plot. It's important to note that extrapolation outside the experimental range might be unreliable.
Advantages of the Lineweaver-Burk Plot
-
Linearization: The Lineweaver-Burk plot provides a simple linear representation of the Michaelis-Menten equation, which facilitates easier determination of V<sub>max</sub> and K<sub>m</sub>.
-
Visual Inspection: Allows for quick visual identification of potential errors in data points, as outliers can be easily spotted.
-
Simple Calculations: The calculation of V<sub>max</sub> and K<sub>m</sub> from the slope and intercept is relatively straightforward.
-
Comparison of Enzyme Kinetics: Facilitates direct comparison of kinetic parameters of different enzymes or the same enzyme under different conditions (e.g., different pH, temperature, or presence of inhibitors).
Limitations of the Lineweaver-Burk Plot
Despite its usefulness, the Lineweaver-Burk plot has significant limitations:
-
Weighting of Data: The plot gives undue weight to measurements at low substrate concentrations, where experimental error is often greatest. These points at low substrate concentration (high values of 1/[S]) exert disproportionate influence on the slope and intercept, affecting the accuracy of V<sub>max</sub> and K<sub>m</sub> calculations.
-
Extrapolation: Determination of both V<sub>max</sub> and K<sub>m</sub> involves extrapolation (extending the line to intersect the axes). Extrapolation can introduce substantial error, particularly if the experimental data only covers a narrow range of substrate concentrations.
-
Sensitivity to Error: The reciprocal transformation amplifies experimental errors, especially at high V₀ values (low 1/V₀ values), leading to imprecise estimations of kinetic parameters.
-
Doesn't directly show the Michaelis-Menten hyperbolic curve: The primary advantage is also a disadvantage since it obscures the actual relationship.
Alternatives to the Lineweaver-Burk Plot
Due to its limitations, several alternative methods exist for determining V<sub>max</sub> and K<sub>m</sub>, offering improved accuracy and data handling. These include:
-
Eadie-Hofstee Plot: This plot involves plotting V₀ against V₀/[S]. It's less sensitive to error in low substrate concentrations compared to the Lineweaver-Burk plot.
-
Hanes-Woolf Plot: This plot involves plotting [S]/V₀ against [S]. It offers similar advantages to the Eadie-Hofstee plot.
-
Direct Non-linear Regression: This method involves fitting the Michaelis-Menten equation directly to the data using non-linear regression software. This is generally considered the most accurate and robust method for determining V<sub>max</sub> and K<sub>m</sub>.
Conclusion
The Lineweaver-Burk plot, despite its limitations, provides a valuable visual tool for understanding enzyme kinetics and estimating V<sub>max</sub> and K<sub>m</sub>. Its linear nature simplifies the calculation of these crucial parameters and allows for a straightforward comparison of enzyme activity under various conditions. However, it's crucial to be aware of its limitations, particularly the weighting of data and sensitivity to error. For higher accuracy and robustness, especially when dealing with noisy datasets, non-linear regression analysis of the Michaelis-Menten equation is the preferred method. Understanding the strengths and weaknesses of different plotting methods empowers researchers to choose the most appropriate technique for their specific needs and data characteristics in the realm of enzyme kinetics.
Latest Posts
Latest Posts
-
Where Does Mrna Go After It Leaves The Nucleus
Mar 18, 2025
-
What Is The Difference Between Primary And Secondary Growth
Mar 18, 2025
-
Work Done By An Electric Field
Mar 18, 2025
-
How Much Energy To Be At Zero Kinetic Energy
Mar 18, 2025
-
Current As A Function Of Time
Mar 18, 2025
Related Post
Thank you for visiting our website which covers about Lineweaver Burk Plot How To Calculate Vo' Enzyme . We hope the information provided has been useful to you. Feel free to contact us if you have any questions or need further assistance. See you next time and don't miss to bookmark.
