Lineweaver Burk Plot Of Competitive Inhibition
Muz Play
Mar 21, 2025 · 5 min read
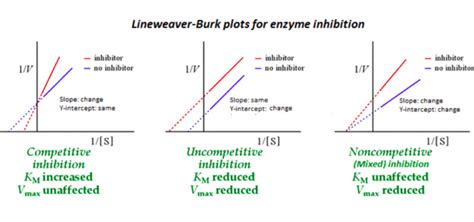
Table of Contents
Lineweaver-Burk Plot of Competitive Inhibition: A Deep Dive
The Lineweaver-Burk plot, also known as a double reciprocal plot, is a graphical representation of the Michaelis-Menten equation. It's a valuable tool in enzymology, allowing researchers to easily visualize and analyze enzyme kinetics, particularly in the context of enzyme inhibition. This article will delve into the specifics of the Lineweaver-Burk plot, focusing on its application in understanding competitive inhibition.
Understanding the Michaelis-Menten Equation and its Limitations
Before diving into the Lineweaver-Burk plot, let's briefly review the Michaelis-Menten equation:
V = (Vmax * [S]) / (Km + [S])
Where:
- V represents the initial reaction velocity.
- Vmax represents the maximum reaction velocity.
- [S] represents the substrate concentration.
- Km represents the Michaelis constant, indicating the substrate concentration at half Vmax.
While the Michaelis-Menten equation provides a fundamental description of enzyme kinetics, its non-linear nature can make it challenging to determine Vmax and Km precisely from experimental data. This is where the Lineweaver-Burk plot comes in handy.
The Lineweaver-Burk Plot: A Linear Transformation
The Lineweaver-Burk plot transforms the Michaelis-Menten equation into a linear form:
1/V = (Km/Vmax)*(1/[S]) + 1/Vmax
This equation represents a straight line with:
- y-intercept = 1/Vmax
- x-intercept = -1/Km
- slope = Km/Vmax
By plotting 1/V against 1/[S], researchers obtain a linear graph, facilitating the accurate determination of Vmax and Km. This linearization simplifies the analysis considerably.
Competitive Inhibition: A Key Mechanism
Competitive inhibition is a type of enzyme inhibition where the inhibitor molecule competes with the substrate for binding to the enzyme's active site. This competition directly affects the enzyme's ability to catalyze the reaction. The inhibitor resembles the substrate enough to bind to the active site, but it doesn't undergo catalysis.
Characteristics of Competitive Inhibition
- Reversibility: Competitive inhibition is typically reversible. Increasing the substrate concentration can overcome the inhibitory effect.
- Active Site Binding: The inhibitor directly binds to the enzyme's active site.
- Effect on Vmax: Vmax remains unchanged in the presence of a competitive inhibitor. With sufficient substrate, the inhibitor can be outcompeted.
- Effect on Km: Km increases in the presence of a competitive inhibitor. A higher substrate concentration is needed to achieve half-maximal velocity.
Lineweaver-Burk Plot in Competitive Inhibition: Visualizing the Effects
The Lineweaver-Burk plot provides a powerful visual representation of the effects of competitive inhibition. Let's analyze the key changes observed:
1. Multiple Lines: A Visual Cue
When conducting experiments with varying inhibitor concentrations, multiple lines will appear on the Lineweaver-Burk plot. Each line represents a different inhibitor concentration.
2. Constant Vmax: Maintaining the y-intercept
Notice that all the lines will intersect at the same point on the y-axis. This point corresponds to 1/Vmax. The fact that the y-intercept remains constant visually confirms that Vmax is unchanged by the competitive inhibitor.
3. Shifting x-intercept: Reflecting Km Change
The x-intercepts, however, will vary with different inhibitor concentrations. As the inhibitor concentration increases, the x-intercept shifts to the left (becoming more negative). This reflects the increase in Km, which is directly proportional to the inhibitor concentration.
4. Parallel Lines: An Indication of Non-Competitive Inhibition (Important Distinction)
It is crucial to differentiate between competitive and non-competitive inhibition. Non-competitive inhibitors bind to an allosteric site, altering the enzyme's shape and reducing its activity. In a Lineweaver-Burk plot of non-competitive inhibition, the lines will intersect at the y-axis but will be parallel, indicating a change in both Vmax and Km. This contrast highlights the importance of carefully analyzing the plot.
Deriving Kinetic Parameters from the Lineweaver-Burk Plot: A Step-by-Step Guide
Let's break down how to extract meaningful data from a Lineweaver-Burk plot representing competitive inhibition:
-
Data Acquisition: First, conduct enzyme kinetics experiments at various substrate concentrations, both in the absence and presence of different inhibitor concentrations. Measure the initial reaction velocity (V) for each condition.
-
Data Transformation: Transform the data into double reciprocal form (1/V and 1/[S]) for plotting.
-
Plot Generation: Plot 1/V on the y-axis and 1/[S] on the x-axis. Each inhibitor concentration will generate a separate line.
-
Linear Regression: Perform linear regression on each line to determine the slope and y-intercept.
-
Parameter Determination:
- Vmax: The reciprocal of the y-intercept (1/Vmax) provides Vmax.
- Km: The negative reciprocal of the x-intercept (-1/Km) gives Km for each inhibitor concentration. Note that Km will increase with increasing inhibitor concentration.
- Ki (Inhibitor Constant): The Ki value can be determined from the slope's dependence on inhibitor concentration. Various mathematical approaches, including Dixon plots, can be used to precisely determine Ki.
Beyond the Basics: Advanced Applications and Considerations
While the Lineweaver-Burk plot offers a valuable visual and analytical tool, it's crucial to acknowledge its limitations:
- Data Weighting: The Lineweaver-Burk plot disproportionately weights points at low substrate concentrations, potentially exaggerating the influence of experimental errors in these regions.
- Extrapolation: Determining Vmax and Km often involves extrapolating the line to the axes, which can introduce inaccuracies, particularly for the x-intercept.
Despite these limitations, the Lineweaver-Burk plot remains a widely used method for understanding enzyme kinetics and visualizing the effects of competitive inhibitors. Its simplicity and ability to clearly illustrate the key characteristics of competitive inhibition makes it an invaluable teaching and research tool.
Conclusion: Lineweaver-Burk Plot as a Cornerstone in Enzymology
The Lineweaver-Burk plot provides a powerful visual and analytical method for characterizing enzyme kinetics, particularly in the presence of competitive inhibitors. Understanding its principles, interpreting its graphical representation, and applying it appropriately are essential skills for any researcher in enzymology and related fields. While newer, more robust methods are available, the Lineweaver-Burk plot continues to offer a valuable, readily accessible approach for understanding the fundamental principles of enzyme inhibition. The ability to distinguish visually between competitive and non-competitive inhibition underscores its lasting significance in biochemical research. By carefully considering its limitations and combining it with other analytical techniques, researchers can effectively leverage this plot to gain a deep understanding of enzyme mechanisms and inhibitor interactions.
Latest Posts
Latest Posts
-
Definition Of Cultural Lag In Sociology
Mar 21, 2025
-
Kinetic Energy Of A Spring Formula
Mar 21, 2025
-
Programmed And Non Programmed Decision Making
Mar 21, 2025
-
Chart Of Endocrine Glands And Their Hormones
Mar 21, 2025
-
What Are Rows Of The Periodic Table Called
Mar 21, 2025
Related Post
Thank you for visiting our website which covers about Lineweaver Burk Plot Of Competitive Inhibition . We hope the information provided has been useful to you. Feel free to contact us if you have any questions or need further assistance. See you next time and don't miss to bookmark.
