Match Each Graph With The Corresponding Function Type
Muz Play
Mar 21, 2025 · 7 min read
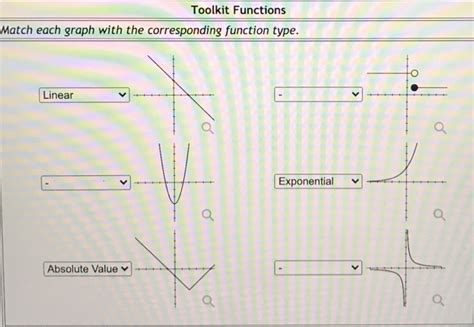
Table of Contents
Matching Graphs with Function Types: A Comprehensive Guide
Identifying the type of function represented by a graph is a fundamental skill in mathematics and various scientific fields. This comprehensive guide will equip you with the knowledge to confidently match graphs with their corresponding function types. We'll cover several common function types, exploring their characteristic shapes, key features, and how to distinguish them visually. This guide will go beyond simple identification, delving into the underlying properties that define each function type.
Understanding Function Types
Before we delve into matching graphs, let's establish a solid foundation by reviewing the key characteristics of several common function types:
1. Linear Functions
- Equation:
y = mx + b(where 'm' is the slope and 'b' is the y-intercept) - Graph: A straight line.
- Key Features: Constant slope (rate of change). The slope determines the steepness and direction (positive slope: upward, negative slope: downward). The y-intercept is where the line crosses the y-axis.
- Visual Identification: Look for a straight, unbroken line. A positive slope indicates an upward trend from left to right, while a negative slope indicates a downward trend. A slope of zero results in a horizontal line.
2. Quadratic Functions
- Equation:
y = ax² + bx + c(where 'a', 'b', and 'c' are constants, and 'a' ≠ 0) - Graph: A parabola (U-shaped curve).
- Key Features: The parabola opens upwards if 'a' > 0 and downwards if 'a' < 0. The vertex is the lowest (or highest) point on the parabola. The axis of symmetry is a vertical line passing through the vertex.
- Visual Identification: Look for a U-shaped curve. Determine if it opens upwards or downwards. Identify the vertex and axis of symmetry.
3. Cubic Functions
- Equation:
y = ax³ + bx² + cx + d(where 'a', 'b', 'c', and 'd' are constants, and 'a' ≠ 0) - Graph: A curve with at most two turning points (local maxima or minima).
- Key Features: The general shape resembles an "S" curve. The number of x-intercepts can be at most three.
- Visual Identification: Look for an S-shaped curve with potential turning points. Observe the number of x-intercepts.
4. Polynomial Functions
- Equation:
y = aₙxⁿ + aₙ₋₁xⁿ⁻¹ + ... + a₁x + a₀(where 'n' is a non-negative integer, and 'aₙ' ≠ 0) - Graph: The shape varies greatly depending on the degree ('n') of the polynomial. Higher-degree polynomials can have more turning points and x-intercepts.
- Key Features: The degree of the polynomial determines the maximum number of turning points (n-1) and x-intercepts (n). The end behavior (what happens to the function as x approaches positive or negative infinity) depends on the degree and the leading coefficient.
- Visual Identification: Analyze the number of turning points and x-intercepts. Observe the end behavior.
5. Exponential Functions
- Equation:
y = abˣ(where 'a' and 'b' are constants, and b > 0, b ≠ 1) - Graph: A curve that increases or decreases rapidly.
- Key Features: If b > 1, the function exhibits exponential growth (increasing rapidly). If 0 < b < 1, the function exhibits exponential decay (decreasing rapidly). The graph never touches the x-axis (asymptotic to the x-axis).
- Visual Identification: Look for a curve that rapidly increases or decreases, approaching but never touching a horizontal asymptote (usually the x-axis).
6. Logarithmic Functions
- Equation:
y = logₐx(where 'a' is the base, and a > 0, a ≠ 1) - Graph: A curve that increases slowly and asymptotically approaches a vertical line.
- Key Features: The graph increases slowly as x increases. The graph approaches but never touches the y-axis (asymptotic to the y-axis). The x-intercept is 1.
- Visual Identification: Look for a curve that increases slowly and approaches a vertical asymptote (usually the y-axis). Note the x-intercept of 1.
7. Rational Functions
- Equation:
y = P(x) / Q(x)(where P(x) and Q(x) are polynomials, and Q(x) ≠ 0) - Graph: Can have various shapes, including asymptotes (vertical, horizontal, or oblique).
- Key Features: Vertical asymptotes occur where the denominator is zero. Horizontal asymptotes depend on the degrees of the numerator and denominator polynomials.
- Visual Identification: Look for curves with potential asymptotes (vertical lines where the function approaches infinity, and horizontal lines the function approaches as x goes to positive or negative infinity).
8. Trigonometric Functions
- Equation: Examples include
y = sin(x),y = cos(x),y = tan(x) - Graph: Periodic functions with repeating patterns.
- Key Features: Sine and cosine functions oscillate between -1 and 1. Tangent functions have vertical asymptotes.
- Visual Identification: Look for repeating wave-like patterns. Identify characteristic features like amplitude, period, and asymptotes.
Matching Graphs to Function Types: Practical Examples
Let's apply our knowledge to some practical examples. Imagine you are presented with several graphs and need to identify the corresponding function type:
Example 1: A straight line passing through points (0, 2) and (1, 5).
- Identification: This is a linear function. The slope is (5-2)/(1-0) = 3, and the y-intercept is 2. The equation is y = 3x + 2.
Example 2: A U-shaped curve with a vertex at (1, -4) opening upwards.
- Identification: This is a quadratic function. Since the parabola opens upwards, the coefficient 'a' in the equation y = ax² + bx + c is positive.
Example 3: An S-shaped curve with two turning points and three x-intercepts.
- Identification: This is likely a cubic function. The presence of two turning points and three x-intercepts suggests a cubic polynomial.
Example 4: A curve that rapidly increases and never touches the x-axis.
- Identification: This is an exponential function exhibiting exponential growth.
Example 5: A curve that slowly increases and approaches the y-axis but never touches it, with an x-intercept of 1.
- Identification: This is a logarithmic function.
Example 6: A curve with a vertical asymptote at x = 2 and a horizontal asymptote at y = 0.
- Identification: This is likely a rational function. The vertical asymptote indicates a factor of (x-2) in the denominator.
Example 7: A wave-like curve oscillating between -1 and 1 with a period of 2π.
- Identification: This could be a sine or cosine function.
Advanced Techniques for Graph Identification
For more complex graphs, or when the characteristics are not immediately obvious, consider these advanced techniques:
-
Analyzing intercepts: Identify the x-intercepts (where the graph crosses the x-axis) and the y-intercept (where the graph crosses the y-axis). These points provide valuable information about the function's behavior.
-
Determining symmetry: Check for symmetry about the y-axis (even function), the origin (odd function), or neither. Symmetry can indicate specific function types.
-
Identifying asymptotes: Look for vertical asymptotes (values of x where the function approaches infinity), horizontal asymptotes (values of y the function approaches as x goes to infinity), and oblique asymptotes (slant asymptotes). Asymptotes are key features of rational functions and some other types.
-
Observing end behavior: What happens to the function as x approaches positive and negative infinity? Does it increase without bound, decrease without bound, or approach a horizontal asymptote? This provides crucial insights into the function's overall behavior.
-
Using calculus (if applicable): If you have knowledge of calculus, analyzing the function's derivatives can help determine critical points (local maxima and minima), concavity, and inflection points.
Conclusion
Matching graphs with their corresponding function types is a crucial skill in mathematics and related fields. By understanding the unique features of various function types – their equations, graphs, key characteristics, and visual identification clues – you can confidently analyze and interpret graphical representations of functions. This guide has provided a comprehensive overview, equipping you with the tools to tackle a wide range of graph identification challenges. Remember to practice regularly, analyzing diverse examples to hone your skills and deepen your understanding of functional relationships. The more you practice, the more intuitive this process will become.
Latest Posts
Latest Posts
-
Boundary Between The Crust And Mantle
Mar 28, 2025
-
Electric Field Of A Disk Of Charge
Mar 28, 2025
-
Active Transport Must Function Continuously Because
Mar 28, 2025
-
The Basic Functional Unit Of The Kidney Is
Mar 28, 2025
-
Weak Development Of Support Examples In Essay
Mar 28, 2025
Related Post
Thank you for visiting our website which covers about Match Each Graph With The Corresponding Function Type . We hope the information provided has been useful to you. Feel free to contact us if you have any questions or need further assistance. See you next time and don't miss to bookmark.
