On The Weak Acid Strong Base Titration Curve
Muz Play
Mar 28, 2025 · 7 min read
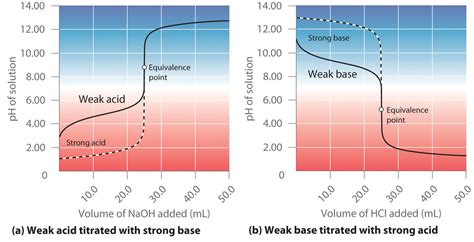
Table of Contents
On the Weak Acid Strong Base Titration Curve: A Comprehensive Guide
The titration curve of a weak acid with a strong base is a fascinating graphical representation of a chemical reaction, offering valuable insights into the solution's pH changes throughout the process. Understanding this curve is crucial for various applications, from analytical chemistry to pharmaceutical development. This comprehensive guide delves deep into the intricacies of weak acid-strong base titrations, exploring the underlying chemistry, interpreting the curve's key features, and highlighting its practical significance.
Understanding the Fundamentals
Before diving into the specifics of the titration curve, let's solidify our understanding of the fundamental concepts involved.
Weak Acids and Strong Bases
A weak acid is a substance that partially dissociates in water, meaning it doesn't completely break down into its constituent ions. This results in an equilibrium between the undissociated acid (HA) and its conjugate base (A⁻) and hydrogen ions (H⁺):
HA ⇌ H⁺ + A⁻
The extent of dissociation is quantified by the acid dissociation constant (Ka), a value that indicates the strength of the weak acid. A smaller Ka value signifies a weaker acid. Examples of weak acids include acetic acid (CH₃COOH), formic acid (HCOOH), and benzoic acid (C₆H₅COOH).
A strong base, in contrast, is a substance that completely dissociates in water, releasing a high concentration of hydroxide ions (OH⁻). Examples include sodium hydroxide (NaOH) and potassium hydroxide (KOH).
The Titration Process
Titration involves the gradual addition of a strong base (the titrant) to a weak acid solution (the analyte). As the base is added, the hydroxide ions react with the hydrogen ions from the weak acid, neutralizing them and shifting the equilibrium towards the formation of more A⁻ ions. This process is monitored by measuring the pH of the solution at various points throughout the titration.
Interpreting the Titration Curve
The resulting graph, plotting pH against the volume of strong base added, is called the titration curve. This curve isn't linear; instead, it exhibits distinct regions that reflect the changing chemical composition of the solution.
Initial pH: Before the Equivalence Point
Initially, the solution contains only the weak acid. The pH is determined by the equilibrium between the weak acid and its conjugate base. The pH can be calculated using the Ka value and the initial concentration of the weak acid using the following equation (simplified for the sake of clarity, assuming negligible dissociation):
pH = -½ log(Ka * [HA]₀)
This equation is based on the assumption that the concentration of hydrogen ions is approximated by the square root of the Ka multiplied by the initial concentration of the weak acid. This approximation is valid only when the concentration of the weak acid is significantly larger than its Ka.
Here, [HA]₀ represents the initial concentration of the weak acid. This pH is relatively low and reflects the weak acidity of the solution. As the strong base is added, the pH starts to increase gradually. This is due to the neutralization reaction that converts the weak acid into its conjugate base.
Buffer Region: Before the Equivalence Point
A crucial characteristic of weak acid-strong base titrations is the presence of a buffer region. This region appears after the initial addition of the strong base, but well before the equivalence point is reached. It is characterized by a relatively gradual increase in pH. This buffering capacity arises from the presence of both the weak acid (HA) and its conjugate base (A⁻) in significant concentrations. The Henderson-Hasselbalch equation describes the pH within this buffer region:
pH = pKa + log([A⁻]/[HA])
This equation demonstrates that the pH is resistant to significant changes upon addition of small amounts of strong base. The pH remains relatively stable in this region because the conjugate base (A⁻) neutralizes any added H⁺ ions, while the weak acid (HA) neutralizes any added OH⁻ ions. The buffer region's length is dependent upon the Ka of the weak acid, with weaker acids having longer buffer regions.
The Equivalence Point
The equivalence point is reached when the moles of strong base added equal the moles of weak acid initially present. At this point, all the weak acid has been neutralized, and the solution contains only the conjugate base. The pH at the equivalence point is greater than 7 because the conjugate base of a weak acid is basic and will undergo hydrolysis:
A⁻ + H₂O ⇌ HA + OH⁻
The pH at the equivalence point can be calculated using the Kb value of the conjugate base. The Kb value can be obtained through the equation: Kw = Ka * Kb.
Kw is the ion product constant of water, which is approximately 1.0 x 10⁻¹⁴ at 25°C. Therefore, Kb = Kw/Ka.
The higher the Ka of the weak acid, the lower the Kb of the conjugate base and the lower the pH at the equivalence point will be.
After the Equivalence Point
Beyond the equivalence point, the addition of further strong base results in a rapid increase in pH. This is because there's no more weak acid to neutralize the added base, and the excess hydroxide ions directly influence the solution's pH. The solution's pH is essentially determined by the excess strong base concentration.
Key Features of the Titration Curve and Their Significance
The weak acid-strong base titration curve showcases several defining features that provide valuable information:
- Initial pH: Provides an indication of the acid's strength. A lower initial pH suggests a stronger weak acid.
- Buffer Region: Demonstrates the solution's resistance to pH changes, highlighting the buffering capacity of the weak acid/conjugate base system. The length of this region is directly related to the Ka value. A smaller Ka yields a longer buffer region.
- Equivalence Point: Marks the complete neutralization of the weak acid. The pH at this point indicates the basicity of the conjugate base, which is inversely proportional to the Ka of the weak acid.
- Post-Equivalence Point: Shows the rapid rise in pH due to the excess strong base. The slope of the curve in this region is steep.
- pKa Determination: The midpoint of the buffer region corresponds to the pKa of the weak acid (where [A⁻] = [HA]). This allows for the experimental determination of the acid's pKa from the titration curve. This is a crucial piece of information for characterizing weak acids.
Practical Applications
Understanding weak acid-strong base titration curves is essential in various fields:
- Analytical Chemistry: Titration is a fundamental analytical technique used to determine the concentration of unknown weak acid solutions.
- Pharmaceutical Industry: Many pharmaceuticals are weak acids or bases. Titration curves are critical in drug formulation and quality control, ensuring accurate dosages and stability.
- Environmental Science: Titration is utilized in analyzing water samples for acidity and the determination of various pollutants.
- Food Science: Titration is employed in determining the acidity of food products, essential in quality control and process optimization.
Factors Affecting the Titration Curve
Several factors can influence the shape and characteristics of the titration curve:
- Concentration of the weak acid: Higher concentrations result in a higher initial pH and a sharper increase in pH around the equivalence point.
- Concentration of the strong base: The concentration of the strong base affects the volume of titrant required to reach the equivalence point.
- Temperature: Temperature influences the Ka of the weak acid and can slightly affect the shape of the curve.
- Presence of other ions: The presence of other ions in the solution can interfere with the titration, altering the shape of the curve.
Conclusion
The weak acid-strong base titration curve is a powerful tool for understanding and characterizing weak acids. Its detailed analysis provides crucial insights into the acid's strength, buffer capacity, and conjugate base's basicity. The information derived from these curves is essential in various scientific disciplines and industrial applications, making the understanding of this phenomenon fundamental for students and professionals alike. By mastering the interpretation of these curves, scientists and researchers can effectively apply this technique in numerous analytical and industrial processes. The principles outlined in this guide, along with careful experimental practices, ensure accurate and reliable results, furthering our understanding of acid-base chemistry and its real-world applications.
Latest Posts
Latest Posts
-
What Is A Reference Group In Sociology
Mar 31, 2025
-
Dividing Polynomials Math Lib Answer Key
Mar 31, 2025
-
What Is Held Constant In Gay Lussacs Law
Mar 31, 2025
-
Example Of A Line In A Poem
Mar 31, 2025
-
Interval Of Convergence Of A Taylor Series
Mar 31, 2025
Related Post
Thank you for visiting our website which covers about On The Weak Acid Strong Base Titration Curve . We hope the information provided has been useful to you. Feel free to contact us if you have any questions or need further assistance. See you next time and don't miss to bookmark.
