T Test Formula For One Sample
Muz Play
Mar 21, 2025 · 6 min read
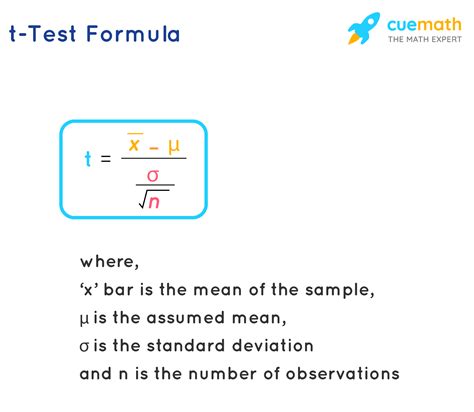
Table of Contents
The One-Sample t-Test: A Comprehensive Guide
The one-sample t-test is a fundamental statistical procedure used to determine if a sample mean differs significantly from a known or hypothesized population mean. Understanding this test is crucial for researchers across various fields, from psychology and education to engineering and medicine. This comprehensive guide will delve into the intricacies of the one-sample t-test, covering its formula, assumptions, interpretations, and practical applications.
Understanding the One-Sample t-Test
The core question addressed by a one-sample t-test is: Does the mean of my sample significantly differ from a pre-specified population mean? This pre-specified population mean is often derived from prior research, theoretical expectations, or a standard value. The test helps us determine if the observed difference is due to random chance or a real effect.
For example:
- A researcher wants to know if the average IQ of students in a particular school differs from the national average IQ of 100.
- A manufacturer wants to test if the average weight of their product conforms to the specified weight of 10 grams.
- A psychologist wants to see if the average stress level of a treatment group differs from the known average stress level of the general population.
The Formula: Deconstructing the One-Sample t-Test
The formula for the one-sample t-test might seem daunting at first, but breaking it down reveals its inherent logic. The t-statistic is calculated as follows:
t = (x̄ - μ) / (s / √n)
Where:
- x̄ (x-bar): This represents the sample mean. It's the average of the data points in your sample. Calculate this by summing all your data points and dividing by the number of data points.
- μ (mu): This is the population mean. This is the value you're comparing your sample mean to. This is a known or hypothesized value.
- s: This is the sample standard deviation. It measures the variability or spread of your data points. A larger standard deviation indicates more variability. The formula for sample standard deviation is: √[Σ(xi - x̄)² / (n - 1)]
- n: This is the sample size—the number of data points in your sample.
Step-by-Step Calculation
Let's illustrate the calculation with a simple example. Suppose a researcher wants to test if the average height of students in a class differs from the national average height of 170 cm. They measure the heights of 25 students, obtaining a sample mean (x̄) of 175 cm and a sample standard deviation (s) of 10 cm.
-
Calculate the difference between the sample mean and the population mean: 175 cm - 170 cm = 5 cm
-
Calculate the standard error of the mean: 10 cm / √25 = 2 cm. The standard error represents the standard deviation of the sampling distribution of the mean.
-
Calculate the t-statistic: 5 cm / 2 cm = 2.5
This t-statistic of 2.5 is the central output of the one-sample t-test. It tells us how many standard errors the sample mean is away from the population mean.
Assumptions of the One-Sample t-Test
Before interpreting the results of a one-sample t-test, it's crucial to ensure that the underlying assumptions are met. Violating these assumptions can lead to inaccurate or misleading conclusions. The key assumptions are:
-
Independence of Observations: Each data point in your sample should be independent of the others. This means that the value of one data point shouldn't influence the value of another. Violation of this assumption often arises from repeated measures designs or clustered data.
-
Normality of the Population: The population from which the sample is drawn should be approximately normally distributed. While the t-test is relatively robust to violations of normality, especially with larger sample sizes (typically n > 30), significant departures from normality can affect the accuracy of the results. Techniques like visual inspection of histograms, Q-Q plots, and formal tests of normality (e.g., Shapiro-Wilk test) can help assess normality.
-
Random Sampling: The sample should be a random sample from the population of interest. A biased sample will not accurately reflect the population, leading to inaccurate inferences.
Interpreting the Results: p-Values and Degrees of Freedom
The calculated t-statistic is then compared to a critical value from the t-distribution. This comparison determines the p-value, which is the probability of obtaining the observed results (or more extreme results) if there were no real difference between the sample mean and the population mean (the null hypothesis).
-
Degrees of Freedom (df): The degrees of freedom for a one-sample t-test are simply n - 1, where n is the sample size. The degrees of freedom determine the shape of the t-distribution.
-
p-Value: The p-value is the probability of observing a t-statistic as extreme as, or more extreme than, the one calculated, assuming the null hypothesis is true. A small p-value (typically less than 0.05) suggests strong evidence against the null hypothesis, leading to the rejection of the null hypothesis. This indicates a statistically significant difference between the sample mean and the population mean.
-
Critical Value: The critical value is the threshold value of the t-statistic that determines whether to reject the null hypothesis. It is determined by the significance level (alpha, usually 0.05) and the degrees of freedom.
One-Sample t-Test vs. Other Tests
The one-sample t-test is just one type of t-test. It's crucial to understand its limitations and when to use alternative tests:
- Two-sample t-test: Compares the means of two independent groups.
- Paired t-test: Compares the means of two related groups (e.g., before-and-after measurements on the same subjects).
- ANOVA (Analysis of Variance): Compares the means of three or more groups.
Choosing the right test depends on your research question and the design of your study.
Practical Applications and Examples
The one-sample t-test has a wide array of applications across disciplines:
-
Clinical Trials: Assessing if a new treatment significantly improves a patient's outcome compared to a known baseline.
-
Quality Control: Determining if the average quality of a product meets a specified standard.
-
Educational Research: Evaluating the effectiveness of an educational intervention by comparing the performance of students to a national average.
-
Environmental Science: Comparing the average pollution level in a specific area to a regulatory limit.
Beyond the Basics: Effect Size and Power Analysis
While the p-value indicates statistical significance, it doesn't tell the whole story. Researchers often consider effect size and power analysis for a more complete understanding of their results.
-
Effect Size: This quantifies the magnitude of the difference between the sample mean and the population mean. Common effect size measures include Cohen's d, which is calculated as (x̄ - μ) / s.
-
Power Analysis: This determines the sample size needed to detect a meaningful difference with a specified level of confidence. A power analysis is essential for planning research studies and ensuring that the study has sufficient power to detect a real effect if one exists.
Conclusion: Mastering the One-Sample t-Test
The one-sample t-test is a powerful tool for analyzing data and drawing meaningful inferences. By understanding its formula, assumptions, interpretation, and limitations, researchers can effectively use this test to answer research questions across a multitude of disciplines. Remember to always consider effect size and power analysis for a more comprehensive understanding of the results. Furthermore, always ensure that the assumptions of the test are met before drawing conclusions. Using appropriate statistical software can significantly simplify the calculation and interpretation of the results. This guide aims to equip you with the knowledge to confidently apply the one-sample t-test in your own research endeavors.
Latest Posts
Latest Posts
-
Sin Cos Tan Csc Sec Cot Graphs
Mar 22, 2025
-
Is Mannitol Salt Agar Selective Or Differential
Mar 22, 2025
-
Cuanto Es Un Cuarto De Galon
Mar 22, 2025
-
How Many Electrons Does Na Have
Mar 22, 2025
-
Is Freezing Water A Chemical Change
Mar 22, 2025
Related Post
Thank you for visiting our website which covers about T Test Formula For One Sample . We hope the information provided has been useful to you. Feel free to contact us if you have any questions or need further assistance. See you next time and don't miss to bookmark.
