Test Statistic Calculator For Chi Square
Muz Play
Mar 24, 2025 · 6 min read
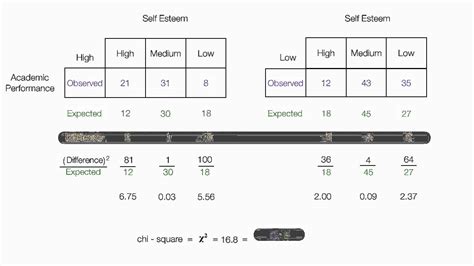
Table of Contents
Chi-Square Test Statistic Calculator: A Comprehensive Guide
The chi-square test is a cornerstone of statistical analysis, used extensively to determine if there's a significant association between categorical variables. Understanding how to calculate the chi-square test statistic is crucial for interpreting results and drawing meaningful conclusions from your data. This comprehensive guide will not only explain the calculation process but also delve into the underlying concepts, different types of chi-square tests, and common applications. We’ll also explore the importance of using a chi-square test statistic calculator and provide you with the knowledge to confidently apply this powerful statistical tool.
Understanding the Chi-Square Test
The chi-square test assesses the difference between observed frequencies (what you actually observed in your data) and expected frequencies (what you would expect to observe if there were no relationship between the variables). A significant difference suggests a relationship exists. The test relies on the chi-square distribution, a probability distribution that's skewed to the right and determined by its degrees of freedom.
Types of Chi-Square Tests
There are several types of chi-square tests, each suited for a specific scenario:
-
Chi-Square Goodness-of-Fit Test: This test compares the observed distribution of a single categorical variable to an expected distribution. For example, you might use it to see if the distribution of colors in a bag of candies matches the manufacturer's stated proportions.
-
Chi-Square Test of Independence: This test investigates the relationship between two categorical variables. It determines whether the variables are independent or if there's an association between them. For example, you might use this to see if there's a relationship between gender and preference for a particular brand of coffee.
-
Chi-Square Test of Homogeneity: This test compares the distribution of a single categorical variable across different populations or groups. For example, you might use this to compare the distribution of political affiliations among different age groups.
Calculating the Chi-Square Test Statistic
The core of the chi-square test is the calculation of the chi-square test statistic (χ²). The formula is as follows:
χ² = Σ [(Oᵢ - Eᵢ)² / Eᵢ]
Where:
- χ² represents the chi-square test statistic.
- Σ denotes the sum across all categories.
- Oᵢ is the observed frequency in category i.
- Eᵢ is the expected frequency in category i.
Calculating Expected Frequencies
Calculating expected frequencies is crucial. The method varies slightly depending on the type of chi-square test:
-
Goodness-of-Fit Test: Expected frequencies are derived from the hypothesized distribution. For instance, if you're testing if a die is fair, the expected frequency for each face would be 1/6 of the total number of rolls.
-
Test of Independence/Homogeneity: Expected frequencies are calculated using the marginal totals. The formula is:
Eᵢⱼ = (Row Totalᵢ * Column Totalⱼ) / Grand Total
Where:
- Eᵢⱼ is the expected frequency for cell (i, j).
- Row Totalᵢ is the total for row i.
- Column Totalⱼ is the total for column j.
- Grand Total is the sum of all observed frequencies.
Step-by-Step Calculation Example (Test of Independence)
Let's illustrate with an example of a chi-square test of independence: We want to investigate if there's a relationship between smoking status (smoker/non-smoker) and lung cancer diagnosis (yes/no). Here's a hypothetical contingency table:
| Lung Cancer (Yes) | Lung Cancer (No) | Total | |
|---|---|---|---|
| Smoker | 50 | 50 | 100 |
| Non-Smoker | 20 | 180 | 200 |
| Total | 70 | 230 | 300 |
1. Calculate Expected Frequencies:
- E₁₁ (Smoker & Lung Cancer Yes): (100 * 70) / 300 = 23.33
- E₁₂ (Smoker & Lung Cancer No): (100 * 230) / 300 = 76.67
- E₂₁ (Non-Smoker & Lung Cancer Yes): (200 * 70) / 300 = 46.67
- E₂₂ (Non-Smoker & Lung Cancer No): (200 * 230) / 300 = 153.33
2. Calculate the Chi-Square Statistic:
Using the formula χ² = Σ [(Oᵢ - Eᵢ)² / Eᵢ]:
- For cell (1,1): (50 - 23.33)² / 23.33 = 28.68
- For cell (1,2): (50 - 76.67)² / 76.67 = 8.53
- For cell (2,1): (20 - 46.67)² / 46.67 = 15.02
- For cell (2,2): (180 - 153.33)² / 153.33 = 4.48
χ² = 28.68 + 8.53 + 15.02 + 4.48 = 56.71
3. Determine Degrees of Freedom:
Degrees of freedom (df) for a test of independence are calculated as:
df = (number of rows - 1) * (number of columns - 1)
In this case, df = (2 - 1) * (2 - 1) = 1
4. Find the p-value:
You'll need a chi-square distribution table or a statistical software to find the p-value associated with χ² = 56.71 and df = 1. The p-value represents the probability of observing the obtained results (or more extreme results) if there's no relationship between the variables. A very small p-value (typically less than 0.05) indicates a statistically significant association.
The Importance of a Chi-Square Test Statistic Calculator
Manually calculating the chi-square statistic, especially with larger contingency tables, can be time-consuming and prone to errors. This is where a chi-square test statistic calculator comes in handy. These calculators automate the entire process, significantly reducing the workload and minimizing the risk of calculation mistakes. Many online calculators are freely available, making statistical analysis more accessible.
Interpreting the Results
Once you have the chi-square statistic and the p-value, you can interpret the results:
-
Low p-value (typically < 0.05): Reject the null hypothesis. There is a statistically significant association between the variables. The observed differences are unlikely to have occurred by chance alone.
-
High p-value (typically ≥ 0.05): Fail to reject the null hypothesis. There is not enough evidence to conclude a statistically significant association between the variables. The observed differences could be due to random chance.
Common Applications of the Chi-Square Test
The chi-square test has a wide range of applications across various fields:
-
Healthcare: Assessing the effectiveness of treatments, analyzing patient demographics, studying disease prevalence.
-
Market Research: Analyzing consumer preferences, studying brand loyalty, investigating the relationship between demographics and purchasing behavior.
-
Social Sciences: Studying social attitudes, analyzing voting patterns, investigating the relationship between social factors and outcomes.
-
Ecology: Analyzing species distribution, studying habitat preferences, investigating the relationship between environmental factors and biodiversity.
Beyond the Basics: Considerations and Limitations
While the chi-square test is a powerful tool, it's important to be aware of its limitations:
-
Large Sample Sizes: With very large sample sizes, even small differences can become statistically significant, potentially leading to misleading conclusions. Consider the practical significance of the findings in addition to statistical significance.
-
Expected Frequencies: The chi-square test is most reliable when expected frequencies in each cell are sufficiently large (typically ≥ 5). If expected frequencies are low, consider alternative methods like Fisher's exact test.
-
Independence of Observations: The observations should be independent of each other. Violations of this assumption can affect the validity of the results.
-
Categorical Data: The chi-square test is only applicable to categorical data. It cannot be used with continuous data.
Conclusion
The chi-square test is a valuable statistical tool for analyzing the relationship between categorical variables. Understanding the calculation process, the different types of chi-square tests, and how to interpret the results are crucial for drawing accurate and meaningful conclusions from your data. Utilizing a chi-square test statistic calculator can streamline the analysis process and reduce the risk of errors. Remember to always consider the limitations of the test and the practical significance of your findings. By mastering this technique, you'll gain valuable skills for conducting robust statistical analysis in various fields.
Latest Posts
Latest Posts
-
Chi Square Calculator For Goodness Of Fit
Mar 26, 2025
-
Advertising Goals Listed In An Advertising Plan Must Be
Mar 26, 2025
-
What Do Hypotheses Theories And Laws Have In Common
Mar 26, 2025
-
What Are The Products Of Neutralization
Mar 26, 2025
-
What Structure Is Most Important In Forming The Tetrads
Mar 26, 2025
Related Post
Thank you for visiting our website which covers about Test Statistic Calculator For Chi Square . We hope the information provided has been useful to you. Feel free to contact us if you have any questions or need further assistance. See you next time and don't miss to bookmark.
