The Variance Is The Square Root Of The Standard Deviation
Muz Play
Apr 01, 2025 · 6 min read
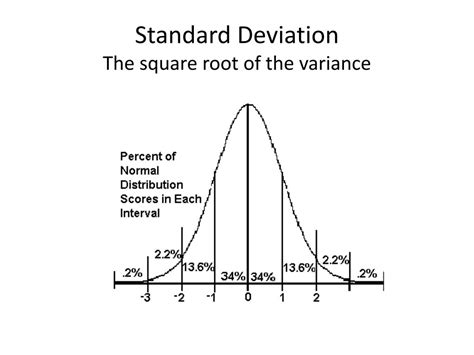
Table of Contents
The Variance is the Square Root of the Standard Deviation: A Common Misconception and the Truth About Dispersion
The statement "the variance is the square root of the standard deviation" is incorrect. This is a common misconception that often arises from a misunderstanding of the fundamental concepts of variance and standard deviation in statistics. In fact, the relationship is precisely the opposite: the standard deviation is the square root of the variance. This article will delve deep into the concepts of variance and standard deviation, explaining their calculations, interpretations, and the crucial difference between them. We'll also explore why understanding this distinction is essential for accurate data analysis and interpretation.
Understanding Variance: A Measure of Spread
Variance is a statistical measure that quantifies the spread or dispersion of a dataset around its mean. A high variance indicates that the data points are widely scattered from the mean, while a low variance suggests that the data points are clustered closely around the mean. In essence, variance tells us how much the individual data points deviate from the average value.
How to Calculate Variance:
The calculation of variance involves several steps:
-
Calculate the mean (average) of the dataset. This is achieved by summing all the data points and dividing by the number of data points.
-
Calculate the deviation of each data point from the mean. This is done by subtracting the mean from each individual data point.
-
Square each deviation. Squaring the deviations ensures that both positive and negative deviations contribute positively to the overall variance. This is crucial because simply summing the deviations would always result in zero.
-
Sum the squared deviations. This gives the total squared deviation from the mean.
-
Divide the sum of squared deviations by the number of data points (or the number of data points minus 1, for sample variance). Dividing by N (population variance) gives the average squared deviation, while dividing by N-1 (sample variance) provides an unbiased estimate of the population variance. The use of N-1 for sample variance is known as Bessel's correction, which helps to prevent underestimation of the population variance.
Example:
Let's consider a small dataset: {2, 4, 6, 8}.
-
Mean: (2 + 4 + 6 + 8) / 4 = 5
-
Deviations: 2-5 = -3; 4-5 = -1; 6-5 = 1; 8-5 = 3
-
Squared Deviations: (-3)² = 9; (-1)² = 1; 1² = 1; 3² = 9
-
Sum of Squared Deviations: 9 + 1 + 1 + 9 = 20
-
Population Variance: 20 / 4 = 5
-
Sample Variance: 20 / (4-1) = 6.67
Understanding Standard Deviation: The Square Root of Variance
The standard deviation is simply the square root of the variance. While variance provides a measure of dispersion in squared units, the standard deviation returns the dispersion in the original units of the data. This makes the standard deviation much easier to interpret in the context of the data itself.
Why Take the Square Root?
Taking the square root of the variance is crucial because:
-
Interpretability: The standard deviation is expressed in the same units as the original data, making it easier to understand and relate back to the context of the data. Variance, on the other hand, is expressed in squared units, which can be less intuitive.
-
Symmetry: The standard deviation provides a more symmetric measure of spread around the mean. Because deviations are squared in variance, larger deviations have a disproportionately large impact on the variance. The square root operation mitigates this effect, providing a more balanced representation of spread.
-
Additivity: In certain statistical contexts, the standard deviation exhibits useful additive properties that are not present in the variance. For instance, when combining independent datasets, it's the standard deviations that are often used in calculating the combined spread.
Example (continuing from the previous example):
-
Population Standard Deviation: √5 ≈ 2.24
-
Sample Standard Deviation: √6.67 ≈ 2.58
This means that the data points in our example are, on average, approximately 2.24 (population) or 2.58 (sample) units away from the mean. This is a much more easily understood measure than the variance.
The Importance of the Distinction
The distinction between variance and standard deviation is critical for several reasons:
-
Clear Communication: Using the correct term avoids confusion and ensures accurate communication of statistical findings.
-
Appropriate Interpretation: Interpreting variance without transforming it into standard deviation can lead to misinterpretations of the data's dispersion.
-
Further Statistical Analysis: Many advanced statistical methods utilize standard deviation rather than variance as a measure of variability. For instance, in hypothesis testing or in determining confidence intervals.
-
Data Visualization: The standard deviation is typically used in visualizing data distributions, such as error bars in graphs or in calculating confidence intervals for means.
Beyond the Basics: Applications and Considerations
Understanding variance and standard deviation extends beyond simple calculations. These concepts are fundamental to various statistical analyses and applications:
-
Descriptive Statistics: They are essential components of descriptive statistics, providing summaries of data distributions.
-
Inferential Statistics: They play a crucial role in inferential statistics, allowing us to make inferences about populations based on sample data. Confidence intervals, hypothesis testing, and regression analysis heavily rely on these measures of dispersion.
-
Risk Assessment: In finance and investment, standard deviation is frequently used as a measure of risk. A higher standard deviation indicates greater volatility and risk.
-
Quality Control: In manufacturing and quality control, standard deviation helps assess the consistency and variability of production processes.
Common Mistakes and Misinterpretations
While the concepts are relatively straightforward, some common mistakes and misinterpretations often occur:
-
Confusing variance and standard deviation: As we've discussed, this is a very common error. Always remember the relationship: standard deviation is the square root of variance.
-
Misinterpreting the units: Remember that variance is in squared units, while standard deviation is in the original units.
-
Ignoring sample vs. population variance: Using the wrong formula (N vs. N-1) leads to inaccurate estimates, especially with small sample sizes.
-
Over-reliance on standard deviation: While standard deviation is useful, it's not always the best measure of dispersion. Other measures, like the interquartile range or median absolute deviation, might be more appropriate in certain situations, particularly when dealing with outliers or skewed data.
Conclusion
In conclusion, while both variance and standard deviation measure data dispersion, they are distinct concepts. The standard deviation is the square root of the variance, and this distinction is not merely a mathematical detail. It's crucial for the proper interpretation of data, effective communication of statistical results, and the successful application of statistical methods in diverse fields. Understanding the nuances of each measure and their relationship empowers data analysts to draw accurate conclusions and make informed decisions based on their findings. Remembering that the standard deviation is the square root of variance, and not the other way around, is fundamental to a clear and accurate understanding of statistical analysis.
Latest Posts
Latest Posts
-
Is Cooking Oil A Pure Substance Or Mixture
Apr 02, 2025
-
Calculate The Binding Energy Per Nucleon
Apr 02, 2025
-
Digestive Disorders Can Seriously Impact Nutrient Transfer And
Apr 02, 2025
-
Why Are Saturated Fats Solid At Room Temperature
Apr 02, 2025
-
How To Divide Exponents In Fractions
Apr 02, 2025
Related Post
Thank you for visiting our website which covers about The Variance Is The Square Root Of The Standard Deviation . We hope the information provided has been useful to you. Feel free to contact us if you have any questions or need further assistance. See you next time and don't miss to bookmark.
