Buffer Region On A Titration Curve
Muz Play
Mar 19, 2025 · 7 min read
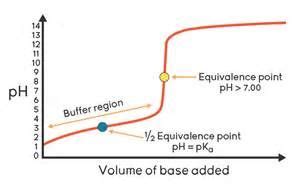
Table of Contents
Understanding the Buffer Region on a Titration Curve
Titration curves are graphical representations of the pH change during a titration. They are essential tools in analytical chemistry, providing valuable insights into the acid-base properties of solutions. A key feature of these curves is the buffer region, a relatively flat segment where the pH changes only gradually upon the addition of titrant. Understanding the buffer region is crucial for selecting appropriate indicators and determining the equivalence point accurately. This article delves deep into the intricacies of the buffer region, explaining its formation, characteristics, and significance in various applications.
What is a Buffer Region?
The buffer region on a titration curve is characterized by a relatively small change in pH despite the addition of a significant amount of strong acid or base. This region exists because the solution being titrated contains a buffer, a solution that resists changes in pH. Buffers typically consist of a weak acid and its conjugate base, or a weak base and its conjugate acid. The presence of both the weak acid and its conjugate base (or weak base and its conjugate acid) allows the buffer to neutralize added H⁺ or OH⁻ ions, minimizing the change in pH.
How Buffers Work: The Chemistry Behind the Flat Region
The effectiveness of a buffer stems from its ability to absorb added H⁺ or OH⁻ ions through equilibrium shifts. Consider a buffer solution containing a weak acid, HA, and its conjugate base, A⁻.
-
Addition of strong acid (H⁺): When a strong acid is added, the added H⁺ ions react with the conjugate base A⁻ to form the weak acid HA:
H⁺ + A⁻ ⇌ HA
This reaction consumes the added H⁺ ions, preventing a significant decrease in pH. The equilibrium shifts to the right, favoring the formation of HA.
-
Addition of strong base (OH⁻): When a strong base is added, the added OH⁻ ions react with the weak acid HA to form water and the conjugate base A⁻:
OH⁻ + HA ⇌ H₂O + A⁻
This reaction consumes the added OH⁻ ions, preventing a significant increase in pH. The equilibrium shifts to the right, favoring the formation of A⁻.
The buffer's capacity to resist pH changes is directly related to the concentrations of the weak acid and its conjugate base. A buffer is most effective when the concentrations of the weak acid and its conjugate base are approximately equal. This is often referred to as the half-equivalence point, where the pH is equal to the pKa of the weak acid (for weak acid-conjugate base buffers).
Identifying the Buffer Region on a Titration Curve
The buffer region is visually apparent on a titration curve as a relatively flat section. It's typically located before the equivalence point in the titration of a weak acid with a strong base, or before the equivalence point in the titration of a weak base with a strong acid. The length and slope of the buffer region depend on the buffer's capacity and the pKa (or pKb) of the weak acid (or weak base).
Characteristics of the Buffer Region:
- Relatively flat: The pH changes slowly with the addition of titrant.
- Centered around the pKa (or pKb): For a weak acid-conjugate base buffer, the midpoint of the buffer region corresponds to the pKa of the weak acid. The pH at this point is approximately equal to the pKa. Similarly, for a weak base-conjugate acid buffer, the midpoint corresponds to the pKb of the weak base. The pH at this point is approximately equal to 14 - pKb.
- Length proportional to buffer capacity: The longer the flat region, the greater the buffer's capacity to resist pH changes. This reflects a higher concentration of both the weak acid and its conjugate base.
Calculating the pH within the Buffer Region: The Henderson-Hasselbalch Equation
The Henderson-Hasselbalch equation is a useful tool for calculating the pH of a buffer solution within the buffer region. The equation is:
pH = pKa + log([A⁻]/[HA])
where:
- pH is the pH of the buffer solution
- pKa is the negative logarithm of the acid dissociation constant (Ka) of the weak acid
- [A⁻] is the concentration of the conjugate base
- [HA] is the concentration of the weak acid
This equation illustrates the relationship between the pH of the buffer, the pKa of the weak acid, and the ratio of the concentrations of the conjugate base and weak acid. When [A⁻] = [HA], the pH = pKa.
Beyond the Buffer Region: Equivalence Point and Endpoint
The buffer region ends as the titration approaches the equivalence point. This is the point where stoichiometrically equivalent amounts of acid and base have reacted. At the equivalence point, the pH changes dramatically with the addition of even a small amount of titrant. This sharp change in pH is used to determine the endpoint of the titration using an indicator. However, it's important to note that the equivalence point and the endpoint are not always identical; there can be a small difference depending on the indicator chosen.
Choosing an appropriate indicator:
The indicator's pKa should be close to the pH at the equivalence point to ensure an accurate determination of the endpoint. For weak acid-strong base titrations, the equivalence point is typically basic, while for weak base-strong acid titrations, the equivalence point is typically acidic.
Applications of Understanding the Buffer Region
The understanding of buffer regions is crucial in a wide range of scientific and technological applications:
1. Biochemistry and Biology:
- Maintaining physiological pH: Biological systems rely heavily on buffers to maintain a stable pH. For instance, the bicarbonate buffer system in blood plays a crucial role in regulating blood pH, preventing drastic changes that could be harmful to cells and tissues.
- Enzyme activity: Many enzymes function optimally within a narrow pH range. Buffers are essential in biochemical experiments to maintain the desired pH and ensure optimal enzyme activity.
- Protein stability: The structure and function of proteins are highly dependent on pH. Buffers are used to maintain a stable pH during protein purification and characterization.
2. Analytical Chemistry:
- Titration analysis: Understanding the buffer region is essential for accurately determining the equivalence point in titrations.
- Buffer preparation: The knowledge of buffer regions allows for the precise preparation of buffer solutions with specific pH values.
3. Environmental Science:
- Water quality monitoring: Buffers are used in environmental studies to maintain the pH of samples and prevent changes that could affect the accuracy of measurements.
- Soil chemistry: Soil pH is critical for plant growth. Buffering capacity of soil influences its ability to resist changes in pH due to acid rain or other factors.
4. Industrial Applications:
- Chemical processing: Buffers are used in many industrial processes to control pH and ensure the stability of reactants and products.
- Pharmaceutical industry: Buffers are used in the formulation of many pharmaceutical products to maintain the desired pH and ensure stability.
Factors Affecting the Buffer Region
Several factors influence the shape and extent of the buffer region on a titration curve:
- Concentration of the buffer components: Higher concentrations of the weak acid and its conjugate base lead to a longer and flatter buffer region, reflecting a greater buffer capacity.
- pKa (or pKb) of the weak acid (or weak base): The buffer region is centered around the pKa (or pKb) value. A buffer with a pKa closer to the desired pH range will have a more effective buffering action in that range.
- Temperature: Temperature affects the Ka (and thus pKa) of a weak acid. Changes in temperature can alter the buffer region's position and shape.
- Ionic strength: The presence of other ions in the solution can influence the activity of the buffer components, subtly affecting the buffer region.
Conclusion
The buffer region on a titration curve is a critical feature reflecting the solution's buffering capacity. Understanding its formation, characteristics, and significance is fundamental to various scientific disciplines. The Henderson-Hasselbalch equation provides a powerful tool for calculating the pH within the buffer region, facilitating precise control and prediction of pH changes. Whether in biochemical experiments, environmental monitoring, or industrial processes, the principles underlying the buffer region remain essential for maintaining stable pH conditions and ensuring accurate experimental results. The interplay between the weak acid, conjugate base, and added titrant elegantly demonstrates the power of equilibrium principles in analytical chemistry and beyond. Mastering this concept is pivotal for any serious student or practitioner working with acid-base chemistry.
Latest Posts
Latest Posts
-
Is H2o An Acid Or Base
Mar 19, 2025
-
What Are The Membrane Bound Organelles
Mar 19, 2025
-
What Does A Penetration Pricing Demand Curve Look Like
Mar 19, 2025
-
How To Calculate Heat Of Reaction In Kj Mol
Mar 19, 2025
-
What Is Zone Of Inhibition In Microbiology
Mar 19, 2025
Related Post
Thank you for visiting our website which covers about Buffer Region On A Titration Curve . We hope the information provided has been useful to you. Feel free to contact us if you have any questions or need further assistance. See you next time and don't miss to bookmark.
