Changes Color At The Endpoint Of A Titration
Muz Play
Mar 16, 2025 · 7 min read
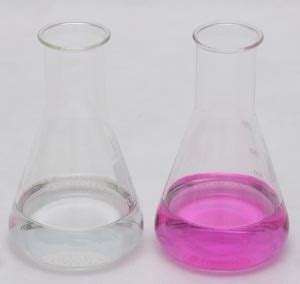
Table of Contents
Indicators That Change Color at the Endpoint of a Titration: A Comprehensive Guide
Titration, a cornerstone of quantitative chemical analysis, relies on carefully controlled reactions to determine the concentration of an unknown solution. A crucial element of this process is the titration indicator, a substance that undergoes a distinct and observable color change at or near the equivalence point of the titration. Understanding how these indicators function and selecting the appropriate one is paramount for accurate and reliable results. This comprehensive guide delves into the intricacies of indicators that change color at the endpoint of a titration, covering their mechanisms, types, applications, and limitations.
Understanding the Endpoint and Equivalence Point
Before diving into the specifics of indicators, it’s crucial to differentiate between the equivalence point and the endpoint.
-
Equivalence Point: This is the theoretical point in a titration where the amount of titrant added is stoichiometrically equivalent to the analyte (the substance being analyzed). It represents the complete neutralization or reaction between the titrant and the analyte. This point is often not directly observable.
-
Endpoint: This is the point at which the indicator changes color, signifying the approximate completion of the reaction. The endpoint is experimentally determined and is often very close to, but not exactly the same as, the equivalence point. The difference between the endpoint and the equivalence point is called the indicator error. Minimizing this error is critical for accurate titration results.
How Titration Indicators Work: The Chemistry of Color Change
Most titration indicators are weak acids or weak bases that exhibit different colors in their acidic and basic forms. The color change is driven by the change in pH during the titration. Let’s consider a weak acid indicator, HIn:
HIn (acid form) <=> H⁺ + In⁻ (base form)
The equilibrium between the acid form (HIn) and the base form (In⁻) determines the color observed. The pKa of the indicator (the negative logarithm of the acid dissociation constant) is crucial; the color change occurs over a pH range approximately one pH unit above and below the pKa value. At pH values significantly below the pKa, the equilibrium lies to the left, and the solution displays the color of the acid form (HIn). Conversely, at pH values significantly above the pKa, the equilibrium shifts to the right, showing the color of the base form (In⁻). Around the pKa, a mixture of both forms is present, resulting in a transitional color.
Types of Titration Indicators
Various indicators are available, each suited for different types of titrations and pH ranges. Some common types include:
1. Acid-Base Indicators:
These are the most widely used indicators, employed in acid-base titrations to detect the neutralization point. Their color change is pH-dependent, as discussed above. Examples include:
-
Phenolphthalein: Colorless in acidic solutions and pink in basic solutions. Its pKa is around 9.4, making it suitable for titrations involving strong acids and strong bases or weak acids and strong bases where the pH at the equivalence point is relatively high.
-
Methyl Orange: Red in acidic solutions and yellow in basic solutions. Its pKa is around 3.7, making it ideal for titrations involving strong acids and weak bases where the equivalence point pH is relatively low.
-
Bromothymol Blue: Yellow in acidic solutions, blue in basic solutions, and green around a neutral pH (pKa ~7). It's useful for titrations with equivalence points near neutrality.
-
Methyl Red: Red in acidic solutions and yellow in basic solutions (pKa ~5). Useful for titrations with equivalence points around pH 5.
-
Litmus: Red in acidic solutions and blue in basic solutions, with a broad pH range of color change. Not as precise as other indicators but offers a general indication of acidity or basicity.
2. Redox Indicators:
These indicators are used in redox titrations (oxidation-reduction titrations). They change color depending on the oxidation state of the indicator molecule. The color change is associated with a change in the oxidation potential of the solution. Examples include:
-
Potassium Permanganate (KMnO₄): Acts as its own indicator. Its intense purple color disappears as it's reduced to Mn²⁺ (colorless) in acidic solutions.
-
Diphenylamine Sulfonic Acid: Used in redox titrations involving dichromate, changing color from colorless to deep blue-violet at the endpoint.
-
Ferroin: A complex of iron and a bipyridyl ligand, used in titrations with cerium(IV) or permanganate. It exhibits a sharp color change from pale blue to red.
3. Adsorption Indicators:
These indicators are used in precipitation titrations. Their color change is linked to adsorption onto the surface of the precipitate formed during the titration. The adsorption process changes the indicator's structure and consequently alters its color. For example, fluorescein is an adsorption indicator commonly used in titrations involving silver halides.
4. Complexometric Indicators:
These indicators are used in complexometric titrations, where a metal ion forms a stable complex with a chelating agent (like EDTA). The indicator forms a colored complex with the metal ion, which dissociates as the chelating agent binds to the metal. Eriochrome Black T is a common example, used in EDTA titrations.
Choosing the Right Indicator: Considerations for Accuracy
Selecting the appropriate indicator is vital for accurate titration results. The key considerations are:
-
pH at the equivalence point: The indicator's pKa should be close to the pH at the equivalence point of the titration. A significant difference between the pKa and the equivalence point pH can lead to a larger indicator error.
-
Sharpness of the color change: The indicator should exhibit a sharp, distinct color change to minimize the uncertainty in determining the endpoint.
-
Concentration of the indicator: Using too much indicator can obscure the color change, while using too little might make the color change indistinct. A small amount of indicator is usually sufficient.
-
Type of titration: The choice of indicator also depends on the type of titration being performed (acid-base, redox, precipitation, complexometric).
-
Interference: The indicator should not interfere with the chemical reaction between the titrant and the analyte.
Limitations and Errors Associated with Indicators
While indicators provide a convenient way to determine the endpoint of a titration, they are not without limitations:
-
Indicator error: As mentioned earlier, the difference between the endpoint and the equivalence point is the indicator error. This error can arise from the indicator's inherent limitations, the concentration of the indicator, and the sharpness of the color change.
-
Subjective nature of color perception: Determining the endpoint often involves a subjective judgment of color change, which can vary between observers.
-
Interference from other substances: The presence of other substances in the solution may interfere with the indicator's color change.
Beyond Visual Indicators: Instrumental Methods
While visual indicators are commonly used, instrumental methods offer greater precision and objectivity in determining the endpoint of a titration. These methods include:
-
pH meters: Directly measure the pH of the solution, providing a more precise determination of the equivalence point in acid-base titrations.
-
Conductivity meters: Measure the change in conductivity of the solution during the titration, useful for titrations where a significant change in conductivity occurs at the equivalence point.
-
Spectrophotometry: Measures the absorbance or transmittance of light through the solution, allowing for endpoint detection based on changes in the solution's color or other optical properties.
Conclusion
Titration indicators are essential tools in quantitative chemical analysis, providing a visual means to determine the endpoint of a titration. Understanding the underlying principles of indicator behavior, selecting the appropriate indicator, and being aware of potential limitations are crucial for obtaining accurate and reliable results. While visual indicators offer a simple and cost-effective approach, instrumental methods offer increased precision and objectivity when higher accuracy is required. The proper selection and use of indicators, combined with careful experimental technique, are essential for success in quantitative chemical analysis. Continuous advancements in indicator chemistry and instrumental techniques will continue to improve the accuracy and efficiency of titration processes.
Latest Posts
Latest Posts
-
Graph Of A Second Order Reaction
Mar 16, 2025
-
Experiment 1 The Densities Of Liquids And Solids
Mar 16, 2025
-
Is Water Boiling A Chemical Change
Mar 16, 2025
-
The Densities Of Liquids And Solids Experiment 1
Mar 16, 2025
-
Are Intermolecular Forces Stronger Than Bonds
Mar 16, 2025
Related Post
Thank you for visiting our website which covers about Changes Color At The Endpoint Of A Titration . We hope the information provided has been useful to you. Feel free to contact us if you have any questions or need further assistance. See you next time and don't miss to bookmark.
