Chi Square Test For Dihybrid Cross
Muz Play
Mar 25, 2025 · 6 min read
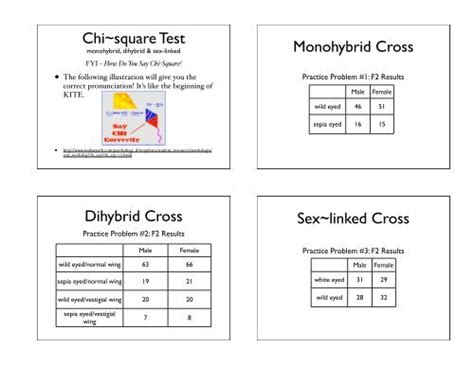
Table of Contents
Chi-Square Test for Dihybrid Cross: A Comprehensive Guide
The dihybrid cross, a fundamental concept in genetics, explores the inheritance patterns of two distinct traits simultaneously. While Punnett squares provide a visual representation of expected genotypic and phenotypic ratios, the reality of biological experiments often deviates from these theoretical predictions. This is where the chi-square (χ²) test steps in, providing a statistical framework to determine if observed experimental results significantly differ from the expected values. This comprehensive guide will delve deep into the application of the chi-square test in analyzing dihybrid cross data, equipping you with the knowledge and tools to perform these analyses effectively.
Understanding the Dihybrid Cross
Before we delve into the statistical analysis, let's revisit the core principles of a dihybrid cross. Consider two traits, each controlled by a single gene with two alleles: one dominant and one recessive. A dihybrid cross involves breeding two individuals heterozygous for both traits (e.g., AaBb x AaBb). According to Mendelian inheritance, we expect a specific phenotypic ratio in the offspring.
Expected Phenotypic Ratios in a Dihybrid Cross
Using a Punnett square, the expected phenotypic ratio for a dihybrid cross involving two independently assorting traits is 9:3:3:1. This translates to:
- 9/16: Individuals exhibiting both dominant phenotypes.
- 3/16: Individuals exhibiting the dominant phenotype for one trait and the recessive phenotype for the other.
- 3/16: Individuals exhibiting the recessive phenotype for the first trait and the dominant phenotype for the second.
- 1/16: Individuals exhibiting both recessive phenotypes.
This 9:3:3:1 ratio forms the basis for our expected values when applying the chi-square test. It's crucial to remember that this ratio assumes independent assortment – that is, the alleles of one gene do not influence the inheritance of the alleles of the other gene.
Introducing the Chi-Square (χ²) Test
The chi-square test is a statistical method used to compare observed data with expected data. It determines the probability that any observed differences are due to random chance or if a significant deviation exists, suggesting a different underlying mechanism (e.g., linkage between genes, non-Mendelian inheritance). The test calculates a χ² value, which is then compared to a critical value from a chi-square distribution table.
The Chi-Square Formula
The formula for the chi-square test is:
χ² = Σ [(Observed - Expected)² / Expected]
Where:
- Observed: The number of individuals observed in each phenotypic class.
- Expected: The number of individuals expected in each phenotypic class based on the theoretical ratio (e.g., 9:3:3:1).
- Σ: Represents the sum across all phenotypic classes.
Degrees of Freedom
The degrees of freedom (df) represent the number of independent variables in the analysis. In a dihybrid cross with four phenotypic classes, the degrees of freedom are calculated as:
df = (number of phenotypic classes) - 1 = 4 - 1 = 3
The degrees of freedom are crucial because they determine the critical χ² value from the chi-square distribution table.
Performing the Chi-Square Test for a Dihybrid Cross: A Step-by-Step Guide
Let's walk through a practical example. Imagine a dihybrid cross experiment involving pea plants, where we're looking at flower color (purple, dominant; white, recessive) and seed shape (round, dominant; wrinkled, recessive). We perform the cross and observe the following results:
- Purple flowers, round seeds: 280
- Purple flowers, wrinkled seeds: 95
- White flowers, round seeds: 90
- White flowers, wrinkled seeds: 35
Step 1: Calculate the Expected Values
Assume a total of 500 offspring (280 + 95 + 90 + 35 = 500). Based on the 9:3:3:1 ratio:
- Expected Purple, Round: (9/16) * 500 = 281.25
- Expected Purple, Wrinkled: (3/16) * 500 = 93.75
- Expected White, Round: (3/16) * 500 = 93.75
- Expected White, Wrinkled: (1/16) * 500 = 31.25
Step 2: Calculate the Chi-Square Value
Using the formula:
χ² = [(280 - 281.25)² / 281.25] + [(95 - 93.75)² / 93.75] + [(90 - 93.75)² / 93.75] + [(35 - 31.25)² / 31.25] χ² ≈ 0.005 + 0.016 + 0.15 + 0.42 ≈ 0.591
Step 3: Determine the Degrees of Freedom
As explained earlier, df = 3.
Step 4: Find the Critical Chi-Square Value
Consult a chi-square distribution table with 3 degrees of freedom and a chosen significance level (usually 0.05, representing a 5% chance of rejecting the null hypothesis when it's true). The critical χ² value at 0.05 significance and 3 df is approximately 7.815.
Step 5: Compare the Calculated and Critical Chi-Square Values
Our calculated χ² value (0.591) is less than the critical χ² value (7.815).
Step 6: Interpret the Results
Since our calculated χ² value is less than the critical value, we fail to reject the null hypothesis. The null hypothesis states that there is no significant difference between the observed and expected values. Therefore, our experimental data are consistent with the expected 9:3:3:1 ratio of a dihybrid cross, suggesting that the genes controlling flower color and seed shape assort independently.
Factors Affecting the Chi-Square Test Results
Several factors can influence the results of a chi-square test:
-
Sample Size: A larger sample size generally leads to a more accurate reflection of the true population ratios and increases the power of the test to detect significant deviations.
-
Significance Level: The significance level (alpha) determines the probability of rejecting the null hypothesis when it is true (Type I error). A lower significance level (e.g., 0.01) makes it harder to reject the null hypothesis.
-
Independent Assortment: The chi-square test assumes independent assortment of genes. If genes are linked, the expected phenotypic ratios will deviate from the 9:3:3:1 ratio, potentially leading to the rejection of the null hypothesis even if Mendelian inheritance is followed, but with linked genes.
Beyond the Basics: Advanced Considerations
While the 9:3:3:1 ratio is a cornerstone of dihybrid crosses, several scenarios can complicate the analysis:
-
Gene Interactions: Epistasis, where one gene masks the expression of another, will drastically alter the expected phenotypic ratios. The chi-square test can still be applied, but the expected values will need to be adjusted based on the specific type of gene interaction.
-
Incomplete Dominance and Codominance: These non-Mendelian inheritance patterns deviate from simple dominant-recessive relationships, necessitating adjustments to the expected phenotypic ratios before applying the chi-square test.
-
Sex-Linked Traits: If one of the traits is sex-linked, the expected phenotypic ratios will differ between males and females, requiring separate analyses for each sex.
-
Multiple Alleles: Traits controlled by more than two alleles will generate more complex phenotypic ratios, and the chi-square test's application will be adapted accordingly.
Conclusion
The chi-square test is an indispensable tool for analyzing the results of dihybrid crosses. It provides a robust statistical framework to determine whether observed phenotypic ratios deviate significantly from the expected Mendelian ratios. By understanding the principles behind the test and carefully considering factors such as sample size, significance level, and potential deviations from simple Mendelian inheritance, you can effectively analyze your dihybrid cross data and draw meaningful conclusions about genetic inheritance. Remember to always carefully consider the biological context of your experiment and interpret your results accordingly, not just relying solely on the statistical outcome. A deep understanding of both genetics and statistics is essential for accurate interpretation.
Latest Posts
Latest Posts
-
Is Mrna Processing Is Same For Prokaryote And Eukaryote
Mar 26, 2025
-
Magnetic Field For A Bar Magnet
Mar 26, 2025
-
What Is A Common Property Of Metals
Mar 26, 2025
-
Curriculum Models In Early Childhood Education
Mar 26, 2025
-
Using Hesss Law To Calculate Net Reaction Enthalpy
Mar 26, 2025
Related Post
Thank you for visiting our website which covers about Chi Square Test For Dihybrid Cross . We hope the information provided has been useful to you. Feel free to contact us if you have any questions or need further assistance. See you next time and don't miss to bookmark.
