Chi Squared Goodness Of Fit Calculator
Muz Play
Mar 24, 2025 · 6 min read
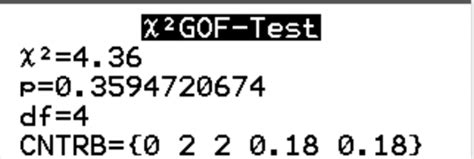
Table of Contents
Chi-Squared Goodness-of-Fit Calculator: A Comprehensive Guide
The chi-squared goodness-of-fit test is a powerful statistical tool used to determine if a sample data set matches a hypothesized distribution. This test is crucial in various fields, from biology and medicine to social sciences and market research. Understanding how to perform this test, and leveraging the assistance of a chi-squared goodness-of-fit calculator, can significantly improve the accuracy and efficiency of your data analysis. This article will provide a comprehensive guide to the chi-squared goodness-of-fit test, explaining its principles, applications, and the benefits of using a calculator.
Understanding the Chi-Squared Goodness-of-Fit Test
The core principle behind the chi-squared goodness-of-fit test is to compare the observed frequencies of data within different categories to the frequencies expected under a specific theoretical distribution. The test determines whether any significant discrepancies exist between the observed and expected frequencies, suggesting a deviation from the hypothesized distribution.
Hypotheses: The test involves formulating two hypotheses:
- Null Hypothesis (H0): The observed data follows the hypothesized distribution. There is no significant difference between the observed and expected frequencies.
- Alternative Hypothesis (H1): The observed data does not follow the hypothesized distribution. There is a significant difference between the observed and expected frequencies.
Calculating the Chi-Squared Statistic: The test statistic, denoted as χ² (chi-squared), is calculated using the following formula:
χ² = Σ [(Oᵢ - Eᵢ)² / Eᵢ]
Where:
- Oᵢ = Observed frequency in category i
- Eᵢ = Expected frequency in category i
- Σ = Summation across all categories
A higher χ² value indicates a larger discrepancy between observed and expected frequencies, suggesting a greater likelihood of rejecting the null hypothesis.
Degrees of Freedom: The degrees of freedom (df) represent the number of independent categories that can vary freely. For a goodness-of-fit test, the degrees of freedom are calculated as:
df = k - p - 1
Where:
- k = Number of categories
- p = Number of parameters estimated from the data (often 0 for simple goodness-of-fit tests)
P-value and Significance Level: Once the chi-squared statistic and degrees of freedom are calculated, a p-value is determined using a chi-squared distribution table or a statistical software. The p-value represents the probability of observing the obtained χ² value (or a more extreme value) if the null hypothesis is true. This p-value is then compared to a predetermined significance level (α), typically set at 0.05.
- If p-value ≤ α: The null hypothesis is rejected, indicating a significant difference between observed and expected frequencies. The data does not fit the hypothesized distribution.
- If p-value > α: The null hypothesis is not rejected, suggesting that the observed data is consistent with the hypothesized distribution.
Applications of the Chi-Squared Goodness-of-Fit Test
The chi-squared goodness-of-fit test has a wide range of applications across diverse fields:
1. Genetics and Biology:
- Hardy-Weinberg Equilibrium: Testing whether gene frequencies in a population are consistent with Hardy-Weinberg equilibrium, a fundamental principle in population genetics.
- Genetic Linkage: Analyzing if the observed inheritance patterns of genes deviate from expected Mendelian ratios, suggesting genetic linkage.
- Species Distribution: Comparing the observed distribution of species in different habitats to a hypothesized distribution.
2. Social Sciences:
- Opinion Polls: Assessing whether survey responses conform to a particular distribution, such as a uniform or normal distribution.
- Social Behavior: Analyzing whether observed social interactions fit a specific theoretical model.
- Market Research: Evaluating if customer preferences align with predetermined market segments.
3. Medicine and Public Health:
- Disease Incidence: Examining whether the observed incidence of a disease across different demographics aligns with expected rates.
- Treatment Efficacy: Comparing the observed outcomes of a treatment group to expected outcomes based on a control group.
- Clinical Trials: Evaluating whether the distribution of patients across treatment groups is as expected.
4. Engineering and Quality Control:
- Product Defects: Determining if the observed number of defects in a manufacturing process follows a Poisson or other specified distribution.
- Manufacturing Processes: Assessing if the output of a production process conforms to pre-defined quality standards.
The Importance of a Chi-Squared Goodness-of-Fit Calculator
Manually calculating the chi-squared statistic, especially with large datasets or numerous categories, can be time-consuming and prone to errors. This is where a chi-squared goodness-of-fit calculator becomes invaluable. These calculators streamline the process, allowing you to:
- Input Data Quickly: Enter your observed and expected frequencies directly into the calculator's interface.
- Automate Calculations: The calculator automatically performs the necessary calculations, including the chi-squared statistic, degrees of freedom, and p-value.
- Reduce Errors: Eliminates the risk of manual calculation errors.
- Save Time: Focus on the interpretation of results rather than the computational aspects.
- Improved Accuracy: Reduces potential errors during manual computations, resulting in more accurate analyses.
- Increased Efficiency: Streamlines the testing process allowing users to perform more tests in a shorter time frame.
- Easy Interpretation: Some calculators present results in a user-friendly format.
Interpreting the Results
After obtaining the chi-squared statistic, degrees of freedom, and p-value from a calculator or statistical software, the next step involves interpreting the results:
- Examine the p-value: If the p-value is less than your significance level (α, usually 0.05), you reject the null hypothesis. This indicates a statistically significant difference between the observed and expected frequencies. The data does not support the hypothesized distribution.
- Consider the Magnitude of the Difference: Even if the p-value suggests a statistically significant difference, the practical significance of the difference should be evaluated. A small difference might be statistically significant but lack practical relevance.
- Visualize the Data: Creating charts and graphs of the observed and expected frequencies can aid in understanding the nature and magnitude of any discrepancies.
- Assess Assumptions: The chi-squared test relies on certain assumptions, such as independence of observations and sufficient expected frequencies in each category (generally, Eᵢ ≥ 5 for all categories). Violations of these assumptions can affect the validity of the results.
Choosing a Chi-Squared Goodness-of-Fit Calculator
Several online calculators and statistical software packages offer chi-squared goodness-of-fit tests. When selecting a calculator, consider the following features:
- Ease of Use: Choose a calculator with a user-friendly interface and clear instructions.
- Accuracy: Ensure the calculator uses accurate algorithms and provides reliable results.
- Additional Features: Some calculators offer additional features such as data visualization, effect size calculations, or the ability to handle different types of hypotheses.
- Reliability: Prioritize calculators with a strong reputation for accuracy and reliability.
Conclusion
The chi-squared goodness-of-fit test is a valuable tool for assessing the fit between observed data and a theoretical distribution. Utilizing a chi-squared goodness-of-fit calculator greatly simplifies the process, enhancing efficiency and reducing the risk of errors. By understanding the principles of this test and leveraging the capabilities of a calculator, researchers and analysts across various disciplines can confidently analyze their data and make informed decisions. Remember to always consider the context of your data and interpret the results in conjunction with other relevant information. The p-value should not be the sole determinant of your conclusions. Always consider effect sizes and the practical implications of your findings. Using a chi-squared calculator responsibly and thoughtfully enhances your ability to derive meaningful insights from your data.
Latest Posts
Latest Posts
-
The Lewis Diagram Below Represents An Aluminum Ion Value
Mar 28, 2025
-
Conditional Probability And The Multiplication Rule
Mar 28, 2025
-
Diagram Of The Life Cycle Of An Angiosperm
Mar 28, 2025
-
What Is The Base Of A Parallelogram
Mar 28, 2025
-
What Is A Zero Dipole Moment
Mar 28, 2025
Related Post
Thank you for visiting our website which covers about Chi Squared Goodness Of Fit Calculator . We hope the information provided has been useful to you. Feel free to contact us if you have any questions or need further assistance. See you next time and don't miss to bookmark.
