Confidence Interval For Population Means Calculator
Muz Play
Mar 20, 2025 · 6 min read
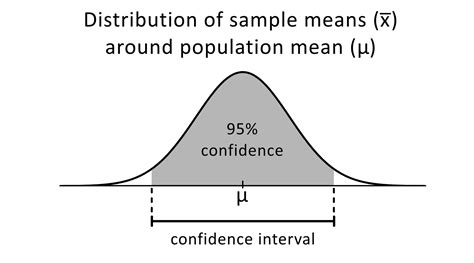
Table of Contents
Confidence Interval for Population Means Calculator: A Comprehensive Guide
Understanding and calculating confidence intervals is crucial in statistical analysis. A confidence interval provides a range of values within which a population parameter, such as the mean, is likely to fall with a certain level of confidence. This article delves deep into the concept of confidence intervals for population means, explaining the underlying principles, the different scenarios (with and without known population standard deviation), and provides practical guidance on utilizing a confidence interval for population means calculator.
What is a Confidence Interval?
A confidence interval is a range of values that likely contains an unknown population parameter. It's expressed as a percentage, commonly 95%, meaning there's a 95% probability that the true population parameter lies within the calculated interval. The remaining 5% represents the chance the interval doesn't contain the true parameter. This doesn't mean there's a 5% chance the true mean is outside the interval, but rather that, if the procedure were repeated many times, 5% of the resulting intervals would fail to contain the true population mean.
The interval is defined by two values: a lower bound and an upper bound. The formula for calculating a confidence interval varies slightly depending on whether the population standard deviation is known or unknown.
Calculating Confidence Intervals for Population Means
There are two primary scenarios when calculating confidence intervals for population means:
1. Population Standard Deviation (σ) is Known
This scenario is less common in real-world applications, as the population standard deviation is rarely known. However, understanding this case provides a foundation for the more practical scenario where σ is unknown.
The formula for the confidence interval when σ is known is:
CI = x̄ ± Z * (σ / √n)
Where:
- CI represents the confidence interval.
- x̄ is the sample mean.
- Z is the Z-score corresponding to the desired confidence level (e.g., 1.96 for a 95% confidence level).
- σ is the population standard deviation.
- n is the sample size.
Example:
Let's say we have a sample of 100 observations, with a sample mean (x̄) of 50 and a known population standard deviation (σ) of 10. For a 95% confidence interval, the Z-score is 1.96. The calculation would be:
CI = 50 ± 1.96 * (10 / √100) = 50 ± 1.96
Therefore, the 95% confidence interval is (48.04, 51.96). We can be 95% confident that the true population mean lies within this range.
2. Population Standard Deviation (σ) is Unknown
This is the more realistic scenario. When the population standard deviation is unknown, we estimate it using the sample standard deviation (s). In this case, we use the t-distribution instead of the Z-distribution. The t-distribution accounts for the added uncertainty introduced by estimating the standard deviation from the sample.
The formula for the confidence interval when σ is unknown is:
CI = x̄ ± t * (s / √n)
Where:
- CI represents the confidence interval.
- x̄ is the sample mean.
- t is the t-score corresponding to the desired confidence level and degrees of freedom (df = n - 1).
- s is the sample standard deviation.
- n is the sample size.
Example:
Suppose we have a sample of 25 observations, with a sample mean (x̄) of 75 and a sample standard deviation (s) of 5. For a 95% confidence interval and 24 degrees of freedom (25 - 1), the t-score is approximately 2.064. The calculation would be:
CI = 75 ± 2.064 * (5 / √25) = 75 ± 2.064
Therefore, the 95% confidence interval is (72.936, 77.064).
Understanding the Components of the Confidence Interval Formula
Let's break down the key components of the formulas to better grasp their influence on the interval's width:
-
Sample Mean (x̄): The center of the confidence interval. A larger sample mean shifts the entire interval to the right, while a smaller sample mean shifts it to the left.
-
Standard Error (σ/√n or s/√n): This represents the standard deviation of the sampling distribution of the mean. It measures the variability of sample means around the true population mean. A smaller standard error leads to a narrower confidence interval, indicating greater precision in estimating the population mean. Notice that a larger sample size (n) reduces the standard error, resulting in a narrower interval.
-
Z-score or t-score: This value determines the width of the interval based on the desired confidence level. Higher confidence levels (e.g., 99% vs. 95%) require larger Z or t-scores, resulting in wider confidence intervals. This reflects the increased certainty demanded by a higher confidence level.
Using a Confidence Interval for Population Means Calculator
Several online calculators are available to simplify the process of calculating confidence intervals. These calculators typically require the user to input the sample mean, sample standard deviation, sample size, and desired confidence level. The calculator then performs the necessary calculations and provides the lower and upper bounds of the confidence interval. The use of such a calculator significantly reduces the risk of manual calculation errors.
Tips for using a confidence interval calculator:
-
Ensure accuracy of input data: Double-check your sample mean, sample standard deviation, and sample size before entering them into the calculator. Incorrect input data will lead to an inaccurate confidence interval.
-
Understand the limitations: Remember that a confidence interval is an estimate. It doesn't guarantee that the true population mean falls within the calculated interval.
-
Interpret the results correctly: A narrower confidence interval indicates a more precise estimate of the population mean. A wider interval suggests more uncertainty.
-
Consider the context: The interpretation of the confidence interval should always be considered within the context of the problem.
Factors Affecting Confidence Interval Width
Several factors influence the width of the confidence interval:
-
Sample Size (n): A larger sample size generally leads to a narrower confidence interval, reflecting a more precise estimate of the population mean. This is because larger samples provide more information about the population.
-
Confidence Level: A higher confidence level (e.g., 99%) requires a wider interval than a lower confidence level (e.g., 95%). This is because greater confidence demands a larger range to encompass the true population mean.
-
Population Variability (σ or s): Higher variability (larger standard deviation) results in a wider confidence interval, reflecting increased uncertainty in estimating the population mean.
Applications of Confidence Intervals
Confidence intervals for population means have widespread applications across various fields:
-
Market Research: Determining the average customer satisfaction rating.
-
Quality Control: Assessing the average weight or dimension of a manufactured product.
-
Medical Research: Estimating the average effectiveness of a new treatment.
-
Environmental Science: Measuring the average concentration of a pollutant.
-
Social Sciences: Analyzing the average income or education level of a population subgroup.
Choosing the Right Confidence Level
The choice of confidence level depends on the context of the study and the risk tolerance. A 95% confidence level is commonly used, but higher confidence levels (e.g., 99%) may be preferred when the consequences of an incorrect estimate are severe. However, increasing the confidence level inevitably leads to a wider confidence interval, reducing the precision of the estimate.
Conclusion
Confidence intervals are a fundamental tool for statistical inference. They provide a quantitative measure of uncertainty in estimating population parameters, specifically the population mean in this context. Understanding the principles behind confidence interval calculations, as well as using a confidence interval for population means calculator effectively, is essential for drawing meaningful conclusions from sample data. Remember to always consider the context of your data, the implications of the chosen confidence level, and the limitations of the interval itself when interpreting your results. By carefully considering these aspects, you can leverage confidence intervals to make informed decisions based on your data analysis.
Latest Posts
Latest Posts
-
Is Brittle A Metal Or Nonmetal
Mar 21, 2025
-
What Influences The Rate Of Diffusion
Mar 21, 2025
-
Where Does Cellular Respiration Take Place In Eukaryotic Cells
Mar 21, 2025
-
Chemistry The Molecular Nature Of Matter And Change 10th Edition
Mar 21, 2025
-
Which Element Has The Highest Ionization Energy
Mar 21, 2025
Related Post
Thank you for visiting our website which covers about Confidence Interval For Population Means Calculator . We hope the information provided has been useful to you. Feel free to contact us if you have any questions or need further assistance. See you next time and don't miss to bookmark.
