Corn Genetics And Chi Square Analysis
Muz Play
Mar 22, 2025 · 6 min read
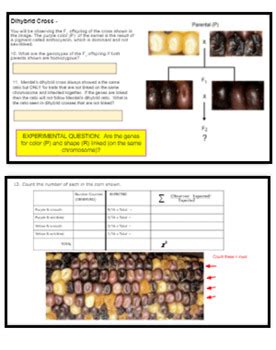
Table of Contents
Corn Genetics and Chi-Square Analysis: Unraveling the Secrets of the Kernel
Corn, or maize (Zea mays), a staple crop worldwide, boasts a rich genetic history and serves as an excellent model organism for studying genetics principles. Its distinct characteristics, such as kernel color and texture, are easily observable and controlled by relatively simple genetic mechanisms, making it ideal for illustrating fundamental genetic concepts and statistical analysis techniques like the Chi-square test. This article delves into the fascinating world of corn genetics, focusing on Mendelian inheritance patterns and demonstrating how the Chi-square test helps us analyze observed phenotypic ratios against expected Mendelian ratios.
Understanding Mendelian Inheritance in Corn
Gregor Mendel's pioneering work on pea plants laid the foundation for our understanding of inheritance. Many of his principles are clearly exemplified in corn genetics. Corn exhibits several easily observable traits governed by simple Mendelian inheritance patterns. Let's examine some key examples:
Kernel Color: A Classic Mendelian Trait
One of the most commonly studied traits in corn genetics is kernel color. The dominant allele, often denoted as C, codes for colored kernels (purple, red, or yellow depending on other genetic factors), while the recessive allele, c, results in colorless, or white, kernels.
- Homozygous dominant (CC): Produces colored kernels.
- Heterozygous (Cc): Produces colored kernels (due to the dominance of C).
- Homozygous recessive (cc): Produces white kernels.
A monohybrid cross between two heterozygous plants (Cc x Cc) would be expected to produce a 3:1 phenotypic ratio (colored:white) in the offspring according to Mendel's law of segregation.
Kernel Texture: Another Mendelian Example
Another easily observable trait is kernel texture. Smooth kernels are generally dominant (Sh) over wrinkled kernels (sh). A similar pattern of inheritance is observed:
- Homozygous dominant (ShSh): Produces smooth kernels.
- Heterozygous (Shsh): Produces smooth kernels.
- Homozygous recessive (shsh): Produces wrinkled kernels.
A monohybrid cross involving kernel texture (Shsh x Shsh) would also yield a predicted 3:1 phenotypic ratio (smooth:wrinkled).
Dihybrid Crosses: Combining Traits
More complex inheritance patterns can be investigated through dihybrid crosses, which consider two traits simultaneously. For example, we can cross a plant homozygous dominant for both kernel color and texture (CCShSh) with a plant homozygous recessive for both traits (ccshsh). The F1 generation will all be heterozygous (CcShsh). A cross between two F1 plants (CcShsh x CcShsh) will yield a more complex phenotypic ratio in the F2 generation, based on Mendel's law of independent assortment. The expected phenotypic ratio is 9:3:3:1 for colored smooth: colored wrinkled: white smooth: white wrinkled kernels.
The Chi-Square Test: Assessing the Goodness of Fit
While Mendel's laws predict expected phenotypic ratios, actual experimental results often deviate slightly. This is due to random chance inherent in the process of fertilization and gamete formation. The Chi-square (χ²) test is a statistical tool that helps us determine if the observed deviations from the expected ratios are significant enough to reject the underlying genetic hypothesis (e.g., Mendelian inheritance).
Calculating the Chi-Square Statistic
The χ² statistic is calculated using the following formula:
χ² = Σ [(Observed - Expected)² / Expected]
Where:
- Observed: The number of individuals observed with a particular phenotype.
- Expected: The number of individuals expected to have that phenotype based on the genetic hypothesis.
- Σ: The sum of the values calculated for each phenotype.
Degrees of Freedom and the P-Value
The degrees of freedom (df) are calculated as the number of phenotypes minus 1. For example, in a monohybrid cross, df = 2 - 1 = 1. The calculated χ² value is then compared to a critical χ² value obtained from a Chi-square distribution table, using the degrees of freedom and a chosen significance level (commonly 0.05 or 5%). This comparison yields a p-value.
- P-value ≤ 0.05: The deviation from the expected ratio is considered statistically significant, meaning the genetic hypothesis may need to be revised or additional factors considered. We reject the null hypothesis.
- P-value > 0.05: The deviation from the expected ratio is not considered statistically significant, suggesting the data supports the genetic hypothesis. We fail to reject the null hypothesis.
Example: Analyzing Corn Kernel Data Using Chi-Square
Let's consider a hypothetical experiment involving a monohybrid cross for kernel color in corn. We cross two heterozygous plants (Cc x Cc) and observe the following results in the offspring:
- Colored kernels: 72
- White kernels: 28
The expected ratio is 3:1 (colored:white), so for a total of 100 kernels, we expect:
- Colored kernels: 75
- White kernels: 25
Now, let's calculate the χ² statistic:
χ² = [(72 - 75)² / 75] + [(28 - 25)² / 25] = 0.36 + 0.36 = 0.72
With 1 degree of freedom (2 phenotypes - 1) and a significance level of 0.05, the critical χ² value from the table is approximately 3.84. Since our calculated χ² (0.72) is less than the critical value (3.84), the p-value is greater than 0.05. Therefore, we fail to reject the null hypothesis, and the observed data supports the expected 3:1 Mendelian ratio for kernel color.
Beyond Simple Mendelian Inheritance: Exploring More Complex Genetics
While many corn traits follow simple Mendelian patterns, many others exhibit more complex inheritance involving multiple genes, gene interactions (epistasis), and environmental influences.
Epistasis: Gene Interactions
Epistasis refers to the interaction between two or more genes where one gene masks the phenotypic expression of another. In corn, numerous examples of epistasis affect kernel color, resulting in variations beyond the simple three-color model. For instance, certain genes might control the production of pigments, while others regulate the deposition of these pigments in the kernel.
Pleiotropy: One Gene, Multiple Effects
Pleiotropy describes the phenomenon where a single gene affects multiple seemingly unrelated traits. This complexity adds another layer of challenge to genetic analysis, as the effects of a single gene mutation can be widespread.
Environmental Influences
Environmental factors, such as temperature, light intensity, and soil nutrient levels, can significantly influence the phenotype of corn plants. These environmental effects can interact with the genotype to produce a range of phenotypes, even within a single genotype. This makes it crucial to control environmental conditions in experiments to minimize confounding variables when analyzing genetic data.
Advanced Statistical Methods
For more complex genetic scenarios, more sophisticated statistical methods beyond the basic Chi-square test are required. These include:
- Analysis of Variance (ANOVA): Useful for analyzing quantitative traits (e.g., plant height, yield) that are influenced by multiple genes and environmental factors.
- Quantitative Trait Loci (QTL) mapping: This technique helps identify specific regions of the genome associated with quantitative traits by combining genetic mapping with statistical analysis.
- Genome-wide association studies (GWAS): GWAS scan the entire genome for genetic variations associated with particular phenotypes, identifying individual genes or genetic markers that contribute to complex traits.
Conclusion: The Power of Corn Genetics and Statistical Analysis
Corn genetics, with its readily observable traits and relatively simple inheritance patterns, serves as a powerful model system for teaching and exploring fundamental genetic principles. The Chi-square test provides a valuable tool for analyzing phenotypic ratios and evaluating the goodness of fit to expected Mendelian ratios. However, it is crucial to remember that many traits exhibit more complex inheritance patterns beyond simple Mendelian expectations, necessitating the use of more advanced statistical methods for thorough analysis. By combining meticulous experimental design with robust statistical analysis, researchers continue to unravel the intricate genetic architecture of corn, leading to improvements in crop yield, disease resistance, and overall agricultural sustainability. The journey of understanding corn genetics is far from over, and the ongoing research holds the promise of further innovations in agriculture and our understanding of life itself.
Latest Posts
Latest Posts
-
Does H6 Have A Higher Percent Mass Than H8
Mar 22, 2025
-
Effective Nuclear Charge Zeff Is Defined As
Mar 22, 2025
-
If Q Is Less Than K
Mar 22, 2025
-
Is Childbirth Positive Or Negative Feedback
Mar 22, 2025
-
How Was The Modern Periodic Table Arranged
Mar 22, 2025
Related Post
Thank you for visiting our website which covers about Corn Genetics And Chi Square Analysis . We hope the information provided has been useful to you. Feel free to contact us if you have any questions or need further assistance. See you next time and don't miss to bookmark.
