Derivatives And The Shape Of A Graph
Muz Play
Mar 16, 2025 · 6 min read
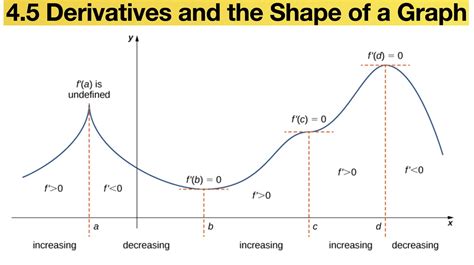
Table of Contents
Derivatives and the Shape of a Graph: A Comprehensive Guide
Understanding the relationship between derivatives and the shape of a graph is fundamental to calculus and its applications in various fields. This comprehensive guide explores this relationship, delving into how derivatives reveal crucial information about a function's behavior, including its increasing and decreasing intervals, concavity, inflection points, and extrema. We'll examine these concepts with detailed explanations, practical examples, and visual aids to solidify your understanding.
Understanding the First Derivative: Slope and Monotonicity
The first derivative, denoted as f'(x) or dy/dx, represents the instantaneous rate of change of a function f(x) at a specific point x. Geometrically, it signifies the slope of the tangent line to the graph of f(x) at that point. This fundamental connection allows us to analyze the function's behavior based on the sign of its derivative.
Increasing and Decreasing Intervals
-
f'(x) > 0: If the first derivative is positive over an interval, the function is increasing on that interval. The tangent lines have positive slopes, indicating that the graph is rising.
-
f'(x) < 0: If the first derivative is negative over an interval, the function is decreasing on that interval. The tangent lines have negative slopes, indicating that the graph is falling.
-
f'(x) = 0: When the first derivative is zero, the tangent line is horizontal. This point can be a local maximum, local minimum, or an inflection point. Further analysis is required to determine the nature of this critical point.
Example: Consider the function f(x) = x³ - 3x. Its first derivative is f'(x) = 3x² - 3. Setting f'(x) = 0, we find critical points at x = -1 and x = 1. Analyzing the sign of f'(x) in the intervals (-∞, -1), (-1, 1), and (1, ∞) reveals that f(x) is increasing on (-∞, -1) and (1, ∞) and decreasing on (-1, 1).
Understanding the Second Derivative: Concavity and Inflection Points
The second derivative, denoted as f''(x) or d²y/dx², represents the rate of change of the first derivative. It provides information about the concavity of the graph of f(x).
Concavity
-
f''(x) > 0: If the second derivative is positive over an interval, the function is concave up (or convex) on that interval. The graph curves upwards, resembling a "U" shape.
-
f''(x) < 0: If the second derivative is negative over an interval, the function is concave down on that interval. The graph curves downwards, resembling an inverted "U" shape.
Inflection Points
An inflection point occurs where the concavity of the function changes. This happens when the second derivative changes sign, i.e., f''(x) = 0 or f''(x) is undefined and there's a change in concavity around that point. It's crucial to note that f''(x) = 0 is a necessary but not sufficient condition for an inflection point; the concavity must actually change.
Example: Continuing with f(x) = x³ - 3x, its second derivative is f''(x) = 6x. f''(x) = 0 when x = 0. Analyzing the sign of f''(x) shows that f(x) is concave down for x < 0 and concave up for x > 0. Therefore, x = 0 is an inflection point.
Local Extrema: Maxima and Minima
Local extrema represent the highest or lowest points within a specific interval of the function's domain. The first and second derivatives are instrumental in identifying them.
First Derivative Test
The first derivative test uses the sign of the first derivative around a critical point (where f'(x) = 0 or is undefined) to determine the nature of the extremum:
-
Local Maximum: If f'(x) changes from positive to negative around a critical point, the point represents a local maximum.
-
Local Minimum: If f'(x) changes from negative to positive around a critical point, the point represents a local minimum.
Second Derivative Test
The second derivative test uses the sign of the second derivative at a critical point:
-
Local Maximum: If f'(x) = 0 and f''(x) < 0 at a critical point, the point represents a local maximum.
-
Local Minimum: If f'(x) = 0 and f''(x) > 0 at a critical point, the point represents a local minimum.
-
Inconclusive: If f''(x) = 0, the test is inconclusive, and the first derivative test must be used.
Example: For f(x) = x³ - 3x, we found critical points at x = -1 and x = 1. Using the second derivative test:
- At x = -1, f''(-1) = -6 < 0, indicating a local maximum.
- At x = 1, f''(1) = 6 > 0, indicating a local minimum.
Higher-Order Derivatives and Their Significance
While the first and second derivatives provide the most readily interpretable geometric information, higher-order derivatives also hold significance. For instance:
-
Third Derivative (f'''(x)): Relates to the rate of change of concavity. A change in the rate of concavity can provide further insights into the function's behavior, although it’s less commonly used for basic graphical analysis.
-
Higher-Order Derivatives: Used in more advanced analysis, such as Taylor and Maclaurin series expansions, which provide powerful tools for approximating functions.
Applications and Real-World Examples
The connection between derivatives and the shape of a graph finds widespread applications in various fields:
-
Physics: Analyzing the motion of objects, determining velocity and acceleration from displacement functions.
-
Economics: Optimizing production, profit, and cost functions. Finding marginal cost and marginal revenue.
-
Engineering: Designing optimal structures, analyzing stress and strain distributions.
-
Machine Learning: Optimizing algorithms through gradient descent, which relies heavily on derivatives.
Practical Tips for Graphing Functions Using Derivatives
-
Find the first derivative: Determine the intervals where the function is increasing or decreasing.
-
Find the second derivative: Determine the intervals where the function is concave up or concave down.
-
Find critical points: Solve f'(x) = 0 to locate potential maxima and minima.
-
Apply the first or second derivative test: Classify critical points as local maxima, local minima, or neither.
-
Find inflection points: Solve f''(x) = 0 and check for changes in concavity.
-
Plot key points: Include critical points, inflection points, and intercepts on the graph.
-
Sketch the graph: Connect the points, paying attention to the increasing/decreasing intervals and concavity.
Conclusion
The relationship between derivatives and the shape of a graph is a cornerstone of calculus, providing a powerful tool for analyzing and understanding functions. By skillfully utilizing the first and second derivatives, we can gain valuable insights into a function’s behavior, including its increasing/decreasing intervals, concavity, extrema, and inflection points. This knowledge enables a deeper understanding of mathematical models in diverse fields, enhancing problem-solving and decision-making capabilities. Remember that practice is key to mastering this crucial concept; work through numerous examples to solidify your understanding and build confidence in applying these techniques.
Latest Posts
Latest Posts
-
Determine The Reactions At The Supports
Mar 16, 2025
-
A Mixture In Which The Composition Is Uniform Throughout
Mar 16, 2025
-
How To Break The Nitrogen Off An Imine Mechanism
Mar 16, 2025
-
Changes Color At The Endpoint Of A Titration
Mar 16, 2025
-
An Element That Conducts Heat And Electricity Poorly
Mar 16, 2025
Related Post
Thank you for visiting our website which covers about Derivatives And The Shape Of A Graph . We hope the information provided has been useful to you. Feel free to contact us if you have any questions or need further assistance. See you next time and don't miss to bookmark.
