Draw The Moment Diagram For The Beam
Muz Play
Mar 29, 2025 · 6 min read
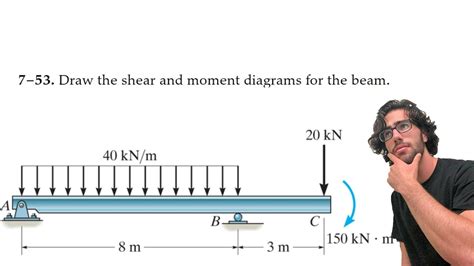
Table of Contents
Drawing Moment Diagrams for Beams: A Comprehensive Guide
Understanding and accurately drawing moment diagrams is crucial for structural engineers and anyone working with beam analysis. A moment diagram visually represents the bending moment along a beam's length, revealing critical information about stress, deflection, and overall structural integrity. This comprehensive guide will walk you through the process, covering various loading conditions and techniques to ensure accurate and efficient diagram creation.
Understanding Bending Moments and Shear Forces
Before diving into drawing moment diagrams, let's solidify our understanding of bending moments and their relationship with shear forces.
What is a Bending Moment?
A bending moment is the internal moment (couple) within a beam caused by external forces and moments applied to it. It represents the rotational tendency at any given section along the beam. Bending moments are typically expressed in Newton-meters (Nm) or pound-feet (lb-ft). Positive bending moments cause a sagging effect (concave upwards), while negative bending moments cause a hogging effect (concave downwards).
Relationship with Shear Force
Shear force and bending moment are intrinsically linked. The rate of change of shear force along a beam is equal to the bending moment at that point. Mathematically:
- dM/dx = V
where:
- M = Bending moment
- V = Shear force
- x = Distance along the beam
This relationship is fundamental to drawing moment diagrams. We often use the shear force diagram as a stepping stone to construct the moment diagram.
Methods for Drawing Moment Diagrams
Several methods can be used to draw moment diagrams. We'll explore two of the most common and effective approaches:
1. The Method of Sections
This method involves cutting the beam at various points and analyzing the internal forces and moments within the resulting sections. It's particularly useful for beams with complex loading conditions.
Steps:
- Draw the Free Body Diagram (FBD): Begin by drawing a complete free body diagram of the entire beam, including all external forces and reactions. Correctly determining the reactions is critical for accuracy.
- Calculate Reactions: Use equilibrium equations (ΣFx = 0, ΣFy = 0, ΣM = 0) to determine the support reactions.
- Choose Section Points: Select points along the beam's length where you want to analyze the bending moment. It is beneficial to choose points at the locations of concentrated loads, concentrated moments, and changes in distributed loads.
- Cut the Beam: Imagine cutting the beam at each chosen section point.
- Analyze the Section: For each section, consider the left or right portion and draw a free body diagram of that portion. Include the internal bending moment (M) and shear force (V) at the cut.
- Apply Equilibrium Equations: Use equilibrium equations to solve for the bending moment (M) at each section. Remember, the sign convention for bending moments is crucial here. Consider clockwise moments as positive and counterclockwise moments as negative (or vice-versa – maintain consistency!).
- Plot the Moments: Plot the calculated bending moments against their respective distances along the beam's length. Connect the points to create the moment diagram.
Example: Consider a simply supported beam with a uniformly distributed load (UDL). By using the method of sections at various points along the beam, we'd find that the bending moment varies parabolically.
2. The Graphical Method (Using Shear Force Diagram)
This method leverages the integral relationship between shear force and bending moment. We first draw the shear force diagram and then use the area under the shear force diagram to calculate changes in the bending moment. This method is particularly efficient for beams with simple to moderately complex loading.
Steps:
- Draw the Shear Force Diagram (SFD): Begin by constructing an accurate shear force diagram for the beam using the method of sections or other appropriate methods.
- Calculate Area Under SFD: The change in bending moment between two points on the beam is equal to the area under the shear force diagram between those points.
- Determine Moment Values: Starting from a point with known bending moment (usually a support where the moment is zero), cumulatively add the areas under the shear force diagram. Remember to account for the sign (positive or negative) of each area.
- Plot the Moments: Plot the calculated bending moments against their respective distances along the beam. Connect the points to form the moment diagram. The resulting curve will reflect the integral of the shear force curve.
Example: For a simply supported beam with a concentrated load, the shear force diagram will show a step change, while the moment diagram will be a triangular shape.
Common Loading Conditions and Their Moment Diagrams
Let's explore some frequently encountered loading conditions and the corresponding moment diagrams. Understanding these scenarios will enhance your ability to predict beam behavior and create accurate diagrams.
1. Simply Supported Beam with a Concentrated Load
A simply supported beam with a single concentrated load at mid-span will have a triangular moment diagram. The maximum bending moment occurs at the point of load application.
2. Simply Supported Beam with a Uniformly Distributed Load (UDL)
A simply supported beam subjected to a UDL will exhibit a parabolic moment diagram. The maximum bending moment occurs at the mid-span.
3. Cantilever Beam with a Concentrated Load
A cantilever beam with a concentrated load at its free end has a linear moment diagram. The maximum bending moment occurs at the fixed support.
4. Cantilever Beam with a Uniformly Distributed Load
A cantilever beam with a UDL has a parabolic moment diagram, with the maximum bending moment at the fixed support.
5. Overhanging Beams
Overhanging beams present a more complex scenario. The moment diagram will typically show a combination of different curves (linear and parabolic segments) depending on the load configuration.
Sign Convention and Interpretation of Moment Diagrams
Consistent sign conventions are essential for accurate interpretation. A common convention is:
- Positive Bending Moment (Sagging): Concave upwards (think of a sagging beam).
- Negative Bending Moment (Hogging): Concave downwards (think of a hogging beam).
The moment diagram's shape indicates how the bending moment changes along the beam. The points where the moment diagram crosses the zero line indicate points of zero bending moment (often inflection points). The maximum value of the moment diagram represents the location and magnitude of the maximum bending moment, which is crucial for stress calculations.
Advanced Techniques and Considerations
1. Superposition
The principle of superposition can be extremely useful when dealing with beams subjected to multiple loads. We can analyze the effects of each load individually and then algebraically add the resulting bending moments to find the total moment at any point.
2. Influence Lines
Influence lines can be a powerful tool for analyzing the effects of moving loads on beams. They graphically represent the variation of bending moment (or other structural responses) at a specific point on the beam as a unit load moves across the structure.
3. Software Tools
Various software packages (e.g., structural analysis programs like SAP2000, ETABS, RISA-3D) provide powerful tools to automate the process of generating moment diagrams.
Conclusion
Accurately drawing moment diagrams is essential for structural analysis and design. Understanding the relationship between shear force and bending moment, mastering different calculation methods (method of sections, graphical method), and familiarity with common loading conditions are vital skills for any structural engineer or aspiring engineer. Remember to always apply consistent sign conventions and utilize available software tools for efficiency and accuracy in complex scenarios. With practice and a solid understanding of the principles presented here, you'll become proficient in generating precise moment diagrams for a wide range of beam configurations.
Latest Posts
Latest Posts
-
How To Solve System Of Equations With Three Variables
Apr 01, 2025
-
Lewis Dot Diagram For 2 Individual Ions For Na
Apr 01, 2025
-
Three Stages Of The Perception Process
Apr 01, 2025
-
Difference Between Solution Suspension And Colloid
Apr 01, 2025
-
Does A Trout Have Upright Erect Posture
Apr 01, 2025
Related Post
Thank you for visiting our website which covers about Draw The Moment Diagram For The Beam . We hope the information provided has been useful to you. Feel free to contact us if you have any questions or need further assistance. See you next time and don't miss to bookmark.
