How To Draw Electron Dot Diagrams
Muz Play
Mar 26, 2025 · 7 min read
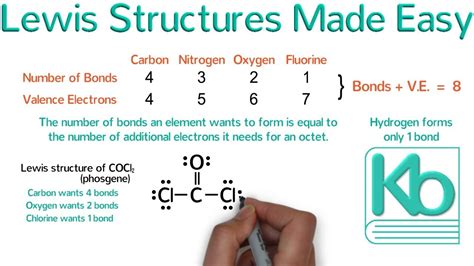
Table of Contents
How to Draw Electron Dot Diagrams: A Comprehensive Guide
Electron dot diagrams, also known as Lewis dot structures, are simplified representations of atoms and molecules that show the valence electrons—the electrons in the outermost shell—as dots surrounding the element's symbol. These diagrams are crucial for understanding chemical bonding, predicting molecular geometry, and visualizing the distribution of electrons within a molecule or ion. This comprehensive guide will walk you through the process of drawing electron dot diagrams, covering various scenarios and providing ample examples.
Understanding the Basics
Before diving into drawing electron dot diagrams, it's essential to grasp some fundamental concepts:
Valence Electrons: The Key Players
Valence electrons are the electrons located in the outermost energy level (shell) of an atom. They are the electrons involved in chemical bonding. The number of valence electrons determines an atom's reactivity and how it will interact with other atoms. You can easily determine the number of valence electrons by looking at an element's group number (column) on the periodic table. For example, elements in Group 1 (alkali metals) have one valence electron, elements in Group 2 (alkaline earth metals) have two, and so on. Transition metals are an exception and require a more nuanced approach, which we'll discuss later.
The Octet Rule: The Driving Force
The octet rule is a guideline that states atoms tend to gain, lose, or share electrons in order to achieve a stable electron configuration with eight valence electrons (like a noble gas). This stable configuration is energetically favorable. However, it's crucial to remember that the octet rule is a guideline, not an absolute law, and there are exceptions, particularly for elements in periods beyond the third period. Hydrogen and helium are exceptions; they only need two electrons to achieve stability (a duet).
Drawing Electron Dot Diagrams for Single Atoms
Drawing electron dot diagrams for single atoms is straightforward. Follow these steps:
-
Identify the element's symbol: Write the symbol of the element in the center.
-
Determine the number of valence electrons: Use the element's group number on the periodic table to find the number of valence electrons.
-
Place the dots around the symbol: Place one dot at a time around the symbol, representing each valence electron. Start by placing one dot on each side (top, right, bottom, left) before pairing dots. This arrangement is not mandatory, but it makes it easier to visualize the distribution.
Examples:
- Oxygen (O): Oxygen is in Group 16, so it has six valence electrons. The electron dot diagram would be:
   ..
:O:
   ..
- Nitrogen (N): Nitrogen is in Group 15, so it has five valence electrons. The electron dot diagram would be:
   .
:N:
  ..
- Sodium (Na): Sodium is in Group 1, so it has one valence electron. The electron dot diagram would be:
Na.
Drawing Electron Dot Diagrams for Molecules
Drawing electron dot diagrams for molecules involves a slightly more complex procedure. You need to consider how atoms share electrons to achieve a stable octet (or duet for hydrogen). Here's a step-by-step guide:
-
Count the total number of valence electrons: Add up the valence electrons from each atom in the molecule. Remember to account for the charge if the molecule is an ion. For example, a -1 charge means adding an additional electron.
-
Identify the central atom: The central atom is typically the least electronegative atom (the atom with the lower attraction for electrons). Carbon is frequently the central atom in organic molecules.
-
Connect the atoms with single bonds: Use single lines (representing two electrons) to connect the central atom to the surrounding atoms.
-
Distribute remaining electrons to satisfy the octet rule: Add the remaining electrons as dots around each atom, aiming to give each atom eight electrons (except for hydrogen, which needs two). If some atoms still don't have an octet, form double or triple bonds by converting lone pairs (pairs of dots) into shared pairs (lines).
-
Check for formal charges: Formal charges indicate the difference between the number of valence electrons in a free atom and the number of electrons assigned to the atom in the Lewis structure. A good Lewis structure aims to minimize formal charges. The formula for formal charge is: Formal Charge = Valence Electrons - (Nonbonding Electrons + ½ Bonding Electrons).
Examples:
-
Water (H₂O):
Oxygen has 6 valence electrons, and each hydrogen has 1. The total is 8. Oxygen is the central atom. Connect oxygen to each hydrogen with a single bond (2 electrons each). Distribute the remaining 4 electrons (8 - 4 = 4) as two lone pairs on oxygen.
.. :Ö: / \ H H -
Carbon Dioxide (CO₂):
Carbon has 4 valence electrons, and each oxygen has 6. The total is 16. Carbon is the central atom. Connect carbon to each oxygen with a double bond (4 electrons each). Distribute the remaining 8 electrons (16 - 8 = 8) as four lone pairs (two on each oxygen).
:Ö::C::Ö: -
Ammonia (NH₃):
Nitrogen has 5 valence electrons, and each hydrogen has 1. The total is 8. Nitrogen is the central atom. Connect nitrogen to each hydrogen with a single bond. Distribute the remaining 2 electrons as a lone pair on nitrogen.
   .
  :N:
 / | \
H  H  H
Dealing with Exceptions to the Octet Rule
Some molecules and ions don't follow the octet rule. These exceptions include:
-
Electron-deficient molecules: These molecules have fewer than eight electrons around the central atom, often seen in compounds containing boron or beryllium.
-
Expanded octet molecules: These molecules have more than eight electrons around the central atom. This is common for elements in the third period and beyond, such as phosphorus, sulfur, and chlorine. They can utilize their d orbitals for bonding.
-
Odd-electron molecules (radicals): These molecules have an odd number of valence electrons, resulting in an unpaired electron.
Drawing electron dot diagrams for these exceptions requires careful consideration of the element's properties and bonding capabilities. It often necessitates some trial and error and consideration of formal charges to find the most stable structure.
Drawing Electron Dot Diagrams for Polyatomic Ions
Polyatomic ions are groups of atoms carrying an overall charge. Drawing their electron dot diagrams is similar to drawing diagrams for molecules, but you need to adjust the total number of valence electrons to reflect the charge:
-
Count total valence electrons: Add the valence electrons of all atoms and adjust for the charge. A negative charge adds electrons, while a positive charge subtracts electrons.
-
Follow steps for molecules: Proceed as you would for molecules, placing brackets around the final structure and indicating the charge outside the brackets.
Example:
-
Nitrate ion (NO₃⁻):
Nitrogen has 5 valence electrons, each oxygen has 6, and the -1 charge adds one more electron. The total is 24. Nitrogen is the central atom. Connect nitrogen to each oxygen with a single bond. Distribute the remaining electrons, and create one double bond to satisfy the octet rule for all atoms.
   :Ö:
  /  \
 :Ö-N=Ö:⁻
  \ /
   :
Practice and Mastery
Mastering electron dot diagrams requires practice. Start with simple molecules and gradually progress to more complex ones. Using online resources and textbooks can provide additional examples and exercises. Remember that there might be multiple valid resonance structures for some molecules. Focusing on minimizing formal charges and achieving octets (where applicable) will help you create the most accurate and stable representations.
Applications of Electron Dot Diagrams
Electron dot diagrams are valuable tools in chemistry, serving several purposes:
-
Predicting molecular geometry: The arrangement of electrons around atoms dictates the molecule's three-dimensional shape.
-
Understanding chemical bonding: Lewis structures help visualize how atoms share electrons to form covalent bonds or transfer electrons to form ionic bonds.
-
Determining polarity: The distribution of electrons reveals whether a molecule is polar (possessing a dipole moment) or nonpolar.
-
Analyzing reactivity: Electron dot diagrams can help predict the reactivity of a molecule or ion based on the availability of lone pairs or unpaired electrons.
By understanding how to draw electron dot diagrams and their implications, you gain a deeper insight into the fundamental principles of chemistry and can more effectively predict and interpret the properties of molecules and ions. This skill forms a foundation for more advanced concepts in chemistry.
Latest Posts
Latest Posts
-
Increasing The Pressure Of A Gas Solution Will
Mar 29, 2025
-
How Many Pi Electrons In A Double Bond
Mar 29, 2025
-
Political Effects Of The Industrial Revolution
Mar 29, 2025
-
Ground State Electron Configuration For C
Mar 29, 2025
-
Where On The Periodic Table Are Metals Found
Mar 29, 2025
Related Post
Thank you for visiting our website which covers about How To Draw Electron Dot Diagrams . We hope the information provided has been useful to you. Feel free to contact us if you have any questions or need further assistance. See you next time and don't miss to bookmark.
