How To Find Expected Frequency From Observed Frequency
Muz Play
Mar 20, 2025 · 5 min read
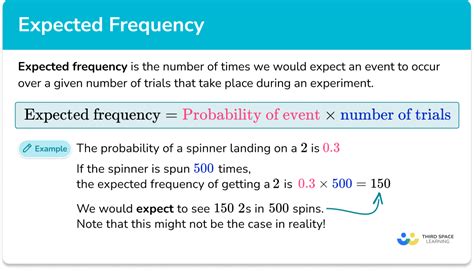
Table of Contents
How to Find Expected Frequency from Observed Frequency: A Comprehensive Guide
Finding the expected frequency from observed frequency is a crucial step in various statistical analyses, particularly in hypothesis testing, specifically chi-squared tests. Understanding this process is vital for determining if observed data significantly deviates from what's expected under a specific hypothesis. This comprehensive guide will walk you through the process, explaining the underlying concepts, providing clear examples, and offering tips for accurate calculations.
Understanding Observed and Expected Frequencies
Before diving into the calculations, let's clarify the core concepts:
-
Observed Frequency: This refers to the actual number of times an event or outcome occurs in a real-world observation or experiment. It's the data you collect directly.
-
Expected Frequency: This is the theoretical count of how many times an event should occur if a specific hypothesis or model is true. It's calculated based on your hypothesis and the total sample size. It represents the predicted frequency under ideal conditions.
The discrepancy between observed and expected frequencies is the foundation of many statistical tests. A large difference might suggest that your hypothesis is incorrect, while a small difference could support it.
Calculating Expected Frequency: Different Scenarios
The method for calculating expected frequency varies depending on the context of your analysis. Here are some common scenarios:
1. Chi-Square Goodness-of-Fit Test
This test assesses whether a sample distribution matches a hypothesized distribution. The expected frequencies are calculated based on the probabilities associated with the hypothesized distribution.
Example:
Let's say you're testing if a six-sided die is fair. Your hypothesis is that each side has an equal probability (1/6) of appearing. You roll the die 60 times and observe the following frequencies:
| Side | Observed Frequency |
|---|---|
| 1 | 8 |
| 2 | 12 |
| 3 | 9 |
| 4 | 10 |
| 5 | 11 |
| 6 | 10 |
Calculation:
Since the hypothesis is that the die is fair, the expected frequency for each side is (1/6) * 60 = 10.
Therefore, your expected frequency table looks like this:
| Side | Observed Frequency | Expected Frequency |
|---|---|---|
| 1 | 8 | 10 |
| 2 | 12 | 10 |
| 3 | 9 | 10 |
| 4 | 10 | 10 |
| 5 | 11 | 10 |
| 6 | 10 | 10 |
2. Chi-Square Test of Independence
This test examines whether two categorical variables are independent of each other. Expected frequencies are calculated based on the marginal totals of the contingency table.
Example:
Imagine you're investigating the relationship between smoking and lung cancer. You collect data and create a contingency table:
| Lung Cancer | No Lung Cancer | Total | |
|---|---|---|---|
| Smoker | 50 | 50 | 100 |
| Non-Smoker | 20 | 180 | 200 |
| Total | 70 | 230 | 300 |
Calculation:
To find the expected frequency for each cell, use the following formula:
(Row Total * Column Total) / Grand Total
For example, the expected frequency for "Smoker" and "Lung Cancer":
(100 * 70) / 300 = 23.33
The complete table with expected frequencies would look like this (rounded for simplicity):
| Lung Cancer | No Lung Cancer | Total | |
|---|---|---|---|
| Smoker | 50 (23.33) | 50 (76.67) | 100 |
| Non-Smoker | 20 (46.67) | 180 (153.33) | 200 |
| Total | 70 | 230 | 300 |
3. Binomial Distribution
If you're dealing with a binomial distribution (where each trial has only two outcomes, success or failure), the expected frequency for each outcome can be calculated using the binomial probability formula.
Formula: E(X) = n * p
where:
- E(X) = Expected frequency of success
- n = Number of trials
- p = Probability of success
Example:
Suppose you flip a coin 100 times. The probability of getting heads (p) is 0.5. The expected frequency of heads is:
E(X) = 100 * 0.5 = 50
Important Considerations When Calculating Expected Frequencies
-
Sufficient Sample Size: Ensure your sample size is large enough. Small sample sizes can lead to inaccurate expected frequencies and unreliable results in hypothesis testing. Generally, expected frequencies should be at least 5 for each category to ensure the validity of the chi-squared test.
-
Rounding: When rounding expected frequencies, maintain consistency. Excessive rounding can introduce errors.
-
Software: Statistical software packages like SPSS, R, or Python (with libraries like SciPy) can automate the calculation of expected frequencies, especially for complex scenarios.
-
Understanding the Hypothesis: The accuracy of your expected frequency calculations hinges on the correctness of your underlying hypothesis. A flawed hypothesis will lead to inaccurate expected frequencies.
Interpreting the Results: Comparing Observed and Expected Frequencies
After calculating both observed and expected frequencies, you use statistical tests, such as the chi-squared test, to determine whether the difference between them is statistically significant. A significant difference suggests that your observed data is unlikely to have arisen by chance alone if your hypothesis were true. Conversely, a non-significant difference supports your hypothesis.
Advanced Applications and Extensions
The concepts of observed and expected frequencies extend beyond basic chi-squared tests. They are fundamental to:
-
Poisson Distribution: Used to model the probability of events occurring in a fixed interval of time or space. Expected frequencies are calculated based on the Poisson rate parameter.
-
Multinomial Distribution: A generalization of the binomial distribution, dealing with more than two outcomes. Expected frequencies are derived from the multinomial probabilities.
-
Simulation Studies: Expected frequencies are used as benchmarks in simulations to assess the performance of different statistical methods.
Conclusion
Calculating expected frequencies from observed frequencies is a cornerstone of statistical analysis. Understanding the various methods and potential pitfalls is crucial for correctly interpreting data and drawing meaningful conclusions. By carefully applying the appropriate techniques and paying attention to assumptions and limitations, you can effectively leverage observed and expected frequencies to strengthen your statistical analyses and gain valuable insights from your data. Remember to always consider the context of your analysis, ensuring your chosen methods are appropriate and your results are interpreted accurately. The accuracy and reliability of your conclusions directly depend on the precision of your expected frequency calculations.
Latest Posts
Latest Posts
-
How Does A Catalyst Influence A Chemical Reaction
Mar 21, 2025
-
List 3 Similarities Between The 3 Types Of Macromolecules
Mar 21, 2025
-
Is Brittle A Metal Or Nonmetal
Mar 21, 2025
-
What Influences The Rate Of Diffusion
Mar 21, 2025
-
Where Does Cellular Respiration Take Place In Eukaryotic Cells
Mar 21, 2025
Related Post
Thank you for visiting our website which covers about How To Find Expected Frequency From Observed Frequency . We hope the information provided has been useful to you. Feel free to contact us if you have any questions or need further assistance. See you next time and don't miss to bookmark.
