How To Find The Boundaries In Statistics
Muz Play
Mar 22, 2025 · 5 min read
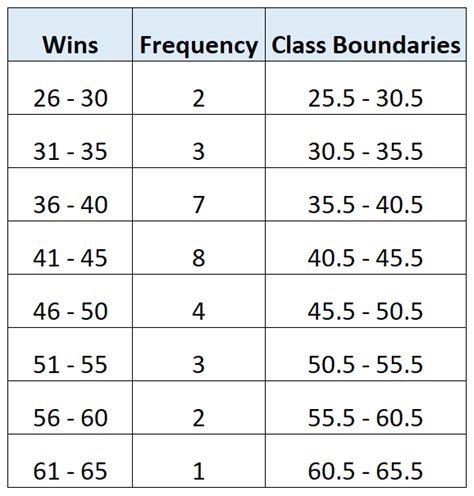
Table of Contents
- How To Find The Boundaries In Statistics
- Table of Contents
- How to Find the Boundaries in Statistics: A Comprehensive Guide
- What are Boundaries in Statistics?
- Why are Boundaries Important?
- Determining Boundaries: Different Methods and Approaches
- 1. Real Class Limits (or True Limits)
- 2. Approximation Method
- 3. Handling Different Data Types
- Applying Boundaries in Statistical Calculations
- 1. Calculating Measures of Central Tendency:
- 2. Calculating Measures of Dispersion:
- Common Mistakes to Avoid
- Advanced Applications and Considerations
- Conclusion: The Importance of Precise Boundary Determination
- Latest Posts
- Latest Posts
- Related Post
How to Find the Boundaries in Statistics: A Comprehensive Guide
Understanding boundaries in statistics is crucial for accurate data analysis and interpretation. Boundaries define the limits of a class interval in a frequency distribution, impacting the calculation of measures like mean, median, and standard deviation. This comprehensive guide will delve into the various methods of determining boundaries, their importance, and how to apply them effectively in different statistical contexts.
What are Boundaries in Statistics?
In statistics, particularly when dealing with grouped data (data presented in class intervals), boundaries represent the precise upper and lower limits of each class interval. They are not the same as the class limits, which are the observed values used to define the intervals. Boundaries are often necessary because raw data may contain continuous variables, while class intervals are discrete. For example, consider a class interval of "50-59." The class limits are 50 and 59, but the boundaries are 49.5 and 59.5. This subtle difference is critical for accurate calculations.
Why are Boundaries Important?
Boundaries are vital for several reasons:
- Accurate Calculations: Using class limits in calculations can lead to significant errors, especially when dealing with measures of central tendency and dispersion. Boundaries ensure that calculations are precise and reflect the true distribution of the data.
- Continuous Data Representation: Boundaries help represent continuous data in a discrete manner. This allows for the effective summarization and analysis of large datasets, which might be impossible to manage otherwise.
- Avoiding Ambiguity: Boundaries eliminate ambiguity regarding which class interval a data point belongs to. Class limits, on the other hand, can leave room for misinterpretation, particularly when dealing with boundary values.
- Consistent Data Analysis: Utilizing consistent boundary determination methods ensures that statistical analyses are reliable and comparable across different datasets and studies.
Determining Boundaries: Different Methods and Approaches
The method for finding boundaries depends on the nature of the data and the level of precision required. The most common methods include:
1. Real Class Limits (or True Limits)
This is the most accurate and widely used method for determining boundaries. It involves adding 0.5 to the upper class limit and subtracting 0.5 from the lower class limit. This method assumes that the data is continuous, even if presented as discrete values.
- Example: For the class interval 10-19, the real class limits would be 9.5 and 19.5. For the class interval 20-24, the real class limits would be 19.5 and 24.5. Note the overlap of 19.5, ensuring a continuous data representation.
2. Approximation Method
In certain situations where the data is clearly discrete, this method provides a simplified boundary determination. Here, the boundaries are directly determined from the class limits. This method should be used cautiously as it lacks the precision of real class limits.
- Example: For a class interval of 10-19 representing whole numbers, the boundaries might be considered as 10 and 19. However, this approach is generally less accurate and is not recommended for continuous data.
3. Handling Different Data Types
The method of determining boundaries should be adjusted based on the data type:
- Continuous Data: Use the real class limits method. Continuous data can take any value within a range (e.g., height, weight, temperature).
- Discrete Data: Approximation methods might be used in some cases. However, even with discrete data, if fine precision is necessary, the real class limit approach is preferred. Discrete data takes on only specific values (e.g., number of children, number of cars).
Applying Boundaries in Statistical Calculations
Once boundaries are determined, they are essential for various statistical calculations:
1. Calculating Measures of Central Tendency:
- Mean: When calculating the mean from grouped data, boundaries are used to find the midpoint of each class interval. This midpoint represents the value of all observations within that interval.
- Median: Finding the median from grouped data involves identifying the class interval containing the median value, using boundaries to determine the exact position of the median within this interval.
- Mode: While the mode is not directly calculated using boundaries, the boundaries help in defining the interval containing the modal class (the class with the highest frequency).
2. Calculating Measures of Dispersion:
- Standard Deviation: Calculating the standard deviation from grouped data requires using the boundaries to determine the midpoint of each class interval and then using these midpoints in the calculation.
- Variance: Similar to the standard deviation, the variance calculation utilizes the midpoints (derived using boundaries) of the class intervals in grouped data.
- Range: While calculating the range using grouped data is straightforward, the true range might necessitate considering the boundaries for a more accurate representation.
Common Mistakes to Avoid
Several common mistakes can occur when working with boundaries in statistics:
- Confusing Boundaries and Class Limits: Failing to distinguish between class limits and boundaries is a significant error, leading to inaccurate calculations.
- Using Incorrect Methods: Employing inappropriate methods for boundary determination based on the data type can yield inaccurate results.
- Inconsistent Application: Inconsistent application of boundary methods across different datasets can lead to biased comparisons and incorrect interpretations.
- Neglecting Boundaries in Calculations: Omitting boundaries in calculations (especially when working with grouped data) results in substantial errors in statistical measures.
Advanced Applications and Considerations
- Histograms: Histograms visually represent frequency distributions. The boundaries determine the width of each bar in a histogram, ensuring an accurate representation of data distribution.
- Ogive Curves: Cumulative frequency distributions are presented graphically using ogive curves. The boundaries are essential for the accurate plotting of points on the curve.
- Data Transformation: Sometimes, data transformation is necessary before analysis. Boundaries play a critical role in ensuring that transformations are applied consistently and accurately to all data points.
- Software Applications: Statistical software packages typically handle boundary determination automatically, but it is essential to understand the underlying methods to interpret the results correctly.
Conclusion: The Importance of Precise Boundary Determination
The precise determination of boundaries is fundamental to accurate and reliable statistical analysis. Understanding the different methods, their applications, and potential pitfalls is crucial for anyone working with statistical data. By mastering the techniques of boundary determination, you'll significantly enhance the accuracy and reliability of your statistical findings, leading to more robust and meaningful conclusions. Always double-check your methods, and remember that choosing the right method depends critically on the nature and characteristics of your dataset. A thorough understanding of boundaries is a cornerstone of effective statistical practice.
Latest Posts
Latest Posts
-
What Is The Relationship Between Temperature And Pressure
Mar 25, 2025
-
Is Toxicity A Physical Or Chemical Property
Mar 25, 2025
-
Plasma Membrane In A Plant Cell
Mar 25, 2025
-
What Are The P Block Elements
Mar 25, 2025
-
Design Primers For Site Directed Mutagenesis
Mar 25, 2025
Related Post
Thank you for visiting our website which covers about How To Find The Boundaries In Statistics . We hope the information provided has been useful to you. Feel free to contact us if you have any questions or need further assistance. See you next time and don't miss to bookmark.
