Sampling Distribution Of The Mean Calculator
Muz Play
Mar 19, 2025 · 6 min read
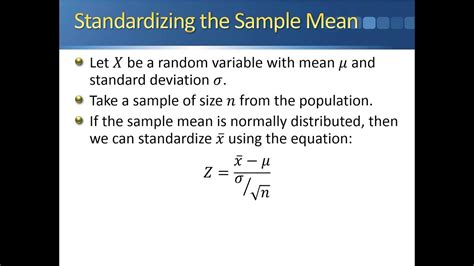
Table of Contents
Sampling Distribution of the Mean Calculator: A Comprehensive Guide
Understanding the sampling distribution of the mean is crucial in inferential statistics. It forms the bedrock of hypothesis testing and confidence interval estimation. While the theoretical concepts can be complex, the practical application is significantly simplified with the use of a sampling distribution of the mean calculator. This comprehensive guide will delve into the intricacies of this vital statistical concept, explain how a calculator streamlines the process, and offer insights into its applications.
What is the Sampling Distribution of the Mean?
The sampling distribution of the mean is the probability distribution of the sample means drawn from a population. Imagine repeatedly taking samples of a specific size (n) from a larger population. For each sample, you calculate the mean. If you plotted all these sample means, you would create the sampling distribution of the mean.
Key Characteristics:
-
Central Limit Theorem (CLT): The CLT is fundamental. It states that regardless of the shape of the original population distribution, the sampling distribution of the mean will approach a normal distribution as the sample size (n) increases. This is true even if the population distribution is skewed. Typically, a sample size of 30 or more is considered sufficient for the CLT to hold.
-
Mean of the Sampling Distribution (µ<sub>x̄</sub>): The mean of the sampling distribution of the mean is equal to the population mean (µ). This implies that the sample means, on average, will center around the true population mean.
-
Standard Error of the Mean (SEM): The standard deviation of the sampling distribution of the mean is called the standard error of the mean (SEM). It measures the variability of the sample means around the population mean. The SEM is calculated as: SEM = σ / √n, where σ is the population standard deviation and n is the sample size. A smaller SEM indicates that the sample means are clustered more tightly around the population mean, suggesting greater precision in estimating the population mean.
-
Standard Deviation vs. Standard Error: It’s crucial to distinguish between the population standard deviation (σ) and the standard error of the mean (SEM). The standard deviation describes the variability within a single sample, while the standard error describes the variability of sample means across multiple samples. The standard error always decreases as the sample size increases.
The Importance of the Sampling Distribution of the Mean
The sampling distribution of the mean is vital for several reasons:
-
Estimating Population Parameters: It allows us to estimate population parameters (like the mean) from sample data. Since it's often impractical or impossible to measure an entire population, we rely on sample data and the sampling distribution to make inferences about the population.
-
Hypothesis Testing: The sampling distribution underpins hypothesis testing. We use it to determine the probability of observing a sample mean as extreme as the one we obtained, assuming the null hypothesis is true. This probability, the p-value, helps us decide whether to reject the null hypothesis.
-
Confidence Intervals: The sampling distribution is used to construct confidence intervals, which provide a range of values within which we are confident the true population mean lies. A 95% confidence interval, for example, means that if we were to repeat the sampling process many times, 95% of the calculated intervals would contain the true population mean.
How a Sampling Distribution of the Mean Calculator Works
A sampling distribution of the mean calculator is a tool that automates the calculations involved in determining key characteristics of the sampling distribution. It typically requires the user to input the following information:
- Population Mean (µ): The average of the entire population.
- Population Standard Deviation (σ): The measure of variability within the population.
- Sample Size (n): The number of observations in each sample.
- Confidence Level: The desired level of confidence for the confidence interval (e.g., 95%, 99%).
The calculator then uses these inputs to perform the following calculations:
- Calculates the Standard Error of the Mean (SEM): As described earlier, SEM = σ / √n.
- Calculates the Margin of Error: This depends on the confidence level and the SEM. For example, for a 95% confidence level, the margin of error is approximately 1.96 * SEM.
- Calculates the Confidence Interval: This is the range within which the true population mean is likely to lie. It is calculated as: Sample Mean ± Margin of Error.
- Provides Visualizations: Many calculators provide visualizations of the sampling distribution, showing the normal distribution and the location of the confidence interval.
Applications of a Sampling Distribution of the Mean Calculator
The applications are diverse and span numerous fields:
-
Quality Control: In manufacturing, the calculator helps determine if the average quality of a product meets the specified standards. Samples are taken from the production line, and the calculator helps assess if the sample mean is significantly different from the target mean.
-
Market Research: Market researchers use it to estimate the average consumer preference for a particular product or service. They collect samples of consumer responses and use the calculator to make inferences about the overall market.
-
Healthcare: In clinical trials, it helps determine if a new drug or treatment has a statistically significant effect on a particular outcome. Sample data from patients receiving the treatment is compared to a control group, and the calculator helps assess the difference in means.
-
Environmental Science: Researchers use it to estimate the average concentration of a pollutant in a particular region. Samples are collected from different locations, and the calculator helps determine if the average concentration is above a safe threshold.
-
Education: Educators use it to assess the effectiveness of a new teaching method. Sample test scores from students taught using the new method are compared to a control group, and the calculator helps determine if there is a statistically significant improvement in performance.
Choosing the Right Sampling Distribution of the Mean Calculator
Several online calculators are available. When selecting one, consider the following factors:
- Accuracy: Ensure the calculator uses accurate formulas and algorithms.
- User-Friendliness: Choose a calculator with a clear and intuitive interface.
- Features: Some calculators offer additional features like visualizations and the ability to adjust parameters.
- Reliability: Select a calculator from a reputable source.
Limitations of Using a Calculator
While incredibly helpful, calculators have limitations:
- Assumptions: The accuracy of the results depends on the assumptions underlying the calculations, such as the normality of the sampling distribution (which is often met thanks to the CLT) and the independence of observations within the samples.
- Data Quality: The accuracy of the calculator's output is heavily dependent on the quality of the input data. Inaccurate or biased data will lead to inaccurate results.
- Interpretation: The calculator provides numerical results but doesn't interpret their meaning. Users must possess a good understanding of statistical concepts to interpret the outputs correctly.
Conclusion
The sampling distribution of the mean calculator is an invaluable tool for anyone working with statistical data. It simplifies complex calculations, making it easier to estimate population parameters, conduct hypothesis tests, and construct confidence intervals. However, it’s crucial to remember the underlying assumptions and limitations of these calculations and to interpret the results carefully. By understanding both the theory and the practical application of the sampling distribution of the mean and utilizing a reliable calculator, you can significantly enhance your ability to analyze data and draw meaningful conclusions. Always ensure your data is representative, and critically examine your results to avoid misinterpretations. Combining the power of a calculator with a strong understanding of statistical principles is the key to unlocking valuable insights from your data.
Latest Posts
Latest Posts
-
Oxidation Number Of Cu In Cuso4
Mar 19, 2025
-
The Shape Of A Protein Determines Its
Mar 19, 2025
-
Energy Produced From The Movement Of Particles In A Substance
Mar 19, 2025
-
Can A Strong Acid And Weak Base Be A Buffer
Mar 19, 2025
-
What Points Is Velocity The Highest
Mar 19, 2025
Related Post
Thank you for visiting our website which covers about Sampling Distribution Of The Mean Calculator . We hope the information provided has been useful to you. Feel free to contact us if you have any questions or need further assistance. See you next time and don't miss to bookmark.
