Shear And Moment Diagram Distributed Load
Muz Play
Mar 16, 2025 · 7 min read
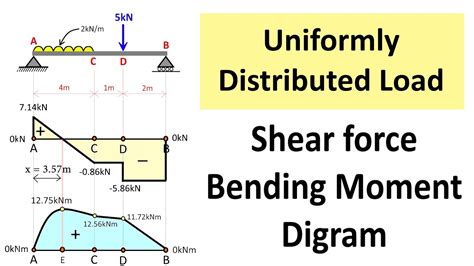
Table of Contents
Shear and Moment Diagrams for Distributed Loads: A Comprehensive Guide
Understanding shear and moment diagrams is crucial for structural engineers and anyone involved in the design and analysis of beams. These diagrams visually represent the internal forces within a beam subjected to various loads, allowing engineers to determine the maximum stresses and ensure the structural integrity of the beam. While point loads are relatively straightforward to analyze, distributed loads introduce a layer of complexity. This article provides a comprehensive guide to understanding and constructing shear and moment diagrams for beams subjected to distributed loads.
What are Shear and Moment Diagrams?
Before delving into distributed loads, let's establish a fundamental understanding of shear and moment diagrams.
-
Shear Diagram: A shear diagram illustrates the variation of shear force along the length of a beam. The shear force at any point is the algebraic sum of the vertical forces acting on either side of that point. A positive shear force indicates upward shear on the left side of the section, while a negative shear force indicates downward shear.
-
Moment Diagram: A moment diagram illustrates the variation of bending moment along the length of a beam. The bending moment at any point is the algebraic sum of the moments of all forces acting on either side of that point. A positive bending moment indicates that the beam is sagging (curving downwards), while a negative bending moment indicates that the beam is hogging (curving upwards).
These diagrams are essential tools for:
- Identifying critical sections: The points of maximum shear and bending moment are crucial for determining the weakest points in a beam's structure.
- Designing for strength: The maximum shear and bending moments are used in the design process to ensure that the beam can withstand the applied loads without failure.
- Understanding beam behavior: The diagrams provide a clear visual representation of how the internal forces are distributed along the beam, helping to understand the beam's overall behavior under load.
Types of Distributed Loads
Distributed loads are loads that are spread over a length of the beam, rather than concentrated at a single point. They are typically represented as a load intensity (force per unit length), usually denoted as w (in units like kN/m or lb/ft). There are several types of distributed loads:
-
Uniformly Distributed Load (UDL): This is the simplest type, where the load intensity is constant along the beam's length. It's often represented as a uniformly shaded rectangle above the beam.
-
Uniformly Varying Load (UVL): This type of load has a linear variation in intensity. It's represented as a triangle or trapezoid above the beam, depending on whether the load intensity starts at zero or a non-zero value.
-
Arbitrary Distributed Load: This encompasses any load distribution that is not uniform or linearly varying. It requires more complex integration techniques for accurate analysis.
Constructing Shear and Moment Diagrams for Distributed Loads
The process of constructing shear and moment diagrams for beams under distributed loads involves several steps. The key is understanding the relationship between the distributed load, the shear force, and the bending moment.
1. Determine the Reactions: The first step is to determine the support reactions at the beam's ends. This involves applying the equations of static equilibrium (ΣF<sub>y</sub> = 0 and ΣM = 0). For distributed loads, the equivalent concentrated load for a distributed load is the total load represented by the area under the distributed load curve. The location of this equivalent point load is at the centroid of the distributed load.
2. Draw the Shear Diagram: The shear force at any point along the beam is calculated by considering the net vertical force acting to the left (or right) of that point. For a UDL, the shear force changes linearly. The slope of the shear diagram is equal to the negative of the distributed load intensity (-w). For UVL, the shear force changes parabolically.
- UDL: The shear diagram will be a straight line with a slope equal to -w.
- UVL: The shear diagram will be a parabolic curve.
- Arbitrary Distributed Load: The shear diagram will reflect the shape of the distributed load, with the slope at any point equal to the negative of the load intensity at that point.
3. Draw the Moment Diagram: The bending moment at any point along the beam is calculated by considering the algebraic sum of the moments of the forces acting on either side of that point. The slope of the moment diagram at any point is equal to the shear force at that point.
- UDL: The moment diagram will be a parabolic curve.
- UVL: The moment diagram will be a cubic curve.
- Arbitrary Distributed Load: The shape of the moment diagram will depend on the complexity of the distributed load; it may involve higher-order curves.
Mathematical Approach (Integration): For more complex distributed loads, a mathematical approach using integration is necessary.
-
Shear Force: The shear force, V(x), at any point x along the beam can be found by integrating the negative of the distributed load intensity:
V(x) = -∫w(x)dx + C<sub>1</sub>
where C<sub>1</sub> is the integration constant determined from boundary conditions (e.g., the shear force at one end of the beam).
-
Bending Moment: The bending moment, M(x), at any point x along the beam can be found by integrating the shear force:
M(x) = ∫V(x)dx + C<sub>2</sub>
where C<sub>2</sub> is the integration constant determined from boundary conditions (e.g., the moment at one end of the beam).
Examples: Shear and Moment Diagrams for Different Distributed Loads
Let's illustrate the process with examples:
Example 1: Simply Supported Beam with UDL
Consider a simply supported beam of length L subjected to a uniformly distributed load of intensity w.
-
Reactions: The reactions at each support are R<sub>A</sub> = R<sub>B</sub> = wL/2.
-
Shear Diagram: The shear diagram starts at wL/2 (at A), decreases linearly to -wL/2 (at B).
-
Moment Diagram: The moment diagram is parabolic, starting at zero at A, reaching a maximum value of wL²/8 at the mid-span (L/2), and returning to zero at B.
Example 2: Simply Supported Beam with UVL (Triangular Load)
Consider a simply supported beam of length L subjected to a triangular distributed load, with intensity varying linearly from 0 at A to w at B.
-
Reactions: The total load is (1/2)wL. The reaction at A is (1/3)wL and at B is (2/3)wL.
-
Shear Diagram: The shear diagram is parabolic. It starts at (1/3)wL at A, and linearly decreases to -(2/3)wL at B.
-
Moment Diagram: The moment diagram is a cubic curve.
Example 3: Cantilever Beam with UDL
Consider a cantilever beam of length L subjected to a uniformly distributed load w.
-
Reactions: The reaction at the fixed end (A) is a vertical force of wL and a moment of wL²/2.
-
Shear Diagram: The shear diagram is linear, starting at wL at A and linearly decreasing to zero at B.
-
Moment Diagram: The moment diagram is parabolic, starting at wL²/2 at A and decreasing to zero at B.
Advanced Concepts and Considerations
-
Multiple Loads: Beams often experience multiple distributed and concentrated loads simultaneously. The shear and moment diagrams are constructed by considering the cumulative effect of all loads.
-
Overhanging Beams: Overhanging beams have portions extending beyond the supports. The analysis requires careful consideration of the reactions at each support.
-
Influence Lines: Influence lines are used to determine the influence of a moving load on shear and moment at a specific point on the beam.
-
Computer-Aided Analysis: Software packages like SAP2000, RISA-2D, and ETABS are commonly used for the analysis of complex structural systems, including beams with complex distributed loads. These software programs can generate precise shear and moment diagrams, relieving the need for manual calculations.
Conclusion
Constructing shear and moment diagrams for beams subjected to distributed loads is a fundamental skill in structural engineering. While the process involves understanding the relationships between load, shear, and moment, employing systematic steps and potentially mathematical integration techniques ensures accurate results. Mastering this skill is essential for the safe and efficient design of structural elements. This comprehensive guide covers the essential concepts, techniques, and examples to aid in a comprehensive understanding of shear and moment diagrams for beams under distributed loads. Remember to always consider the specific characteristics of the distributed load and the boundary conditions when constructing these diagrams.
Latest Posts
Latest Posts
-
According To Dalton Atoms Of Different Elements Will Be
Mar 17, 2025
-
Examples Of Essential And Nonessential Nutrients
Mar 17, 2025
-
Electric Potential From A Point Charge
Mar 17, 2025
-
Whats The Derivative Of A Constant
Mar 17, 2025
-
Differential Rate Law For Zero Order Reaction
Mar 17, 2025
Related Post
Thank you for visiting our website which covers about Shear And Moment Diagram Distributed Load . We hope the information provided has been useful to you. Feel free to contact us if you have any questions or need further assistance. See you next time and don't miss to bookmark.
