Slope In Position Vs Time Graph
Muz Play
Mar 27, 2025 · 6 min read
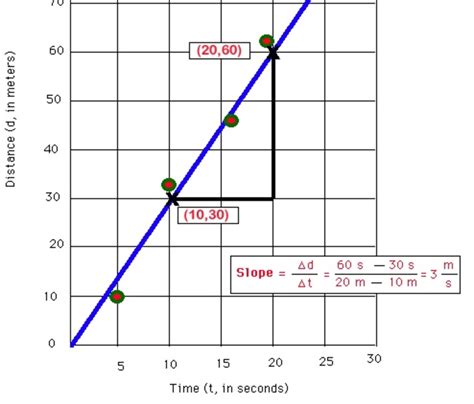
Table of Contents
Understanding Slope in Position vs. Time Graphs: A Comprehensive Guide
The position vs. time graph is a fundamental tool in physics and kinematics, providing a visual representation of an object's movement. Understanding how to interpret the slope of this graph is crucial for extracting valuable information about the object's velocity and acceleration. This comprehensive guide will delve deep into the intricacies of slope interpretation in position vs. time graphs, covering various scenarios and providing practical examples.
What is a Position vs. Time Graph?
A position vs. time graph plots an object's position (usually along a single axis, like x or y) on the vertical axis against time on the horizontal axis. Each point on the graph represents the object's location at a specific time. The graph's shape reveals critical information about the object's motion.
The Significance of Slope
The slope of a position vs. time graph represents the object's velocity. This is a crucial concept to grasp. Remember that slope is calculated as the change in the y-axis value divided by the change in the x-axis value. In this case:
Slope = (Change in Position) / (Change in Time) = Δx / Δt
This formula is precisely the definition of average velocity. Therefore, the steeper the slope, the greater the velocity; a shallow slope indicates a lower velocity.
Understanding Different Slopes
Let's explore the meaning of various slopes in the context of position vs. time graphs:
-
Positive Slope: A positive slope indicates that the object is moving in the positive direction (e.g., moving to the right on a horizontal axis or upwards on a vertical axis). The steeper the positive slope, the faster the object moves in the positive direction.
-
Negative Slope: A negative slope indicates that the object is moving in the negative direction (e.g., moving to the left on a horizontal axis or downwards on a vertical axis). The steeper the negative slope, the faster the object moves in the negative direction.
-
Zero Slope (Horizontal Line): A horizontal line (zero slope) signifies that the object is at rest or stationary; its position is not changing with time.
-
Undefined Slope (Vertical Line): A vertical line represents an undefined slope. This is a physically unrealistic scenario, as it implies that the object has undergone an instantaneous change in position, which is impossible. Such a graph represents a conceptual flaw in the description of motion.
Calculating Velocity from the Slope
The slope of a straight line segment on a position vs. time graph directly gives the average velocity over that time interval. Let's illustrate this with an example:
Example 1:
Imagine an object moving along a straight line. At t = 0 s, its position is x = 2 m. At t = 5 s, its position is x = 12 m.
- Calculate the change in position (Δx): Δx = 12 m - 2 m = 10 m
- Calculate the change in time (Δt): Δt = 5 s - 0 s = 5 s
- Calculate the slope (average velocity): Slope = Δx / Δt = 10 m / 5 s = 2 m/s
Therefore, the average velocity of the object over this 5-second interval is 2 m/s.
Dealing with Non-Linear Graphs (Curved Lines)
Not all motion is uniform. Many real-world scenarios involve non-uniform motion, resulting in curved lines on the position vs. time graph. In such cases, the slope at a specific point represents the instantaneous velocity at that point. We use calculus to find the instantaneous velocity, specifically finding the derivative of the position function with respect to time. However, without calculus, we can estimate instantaneous velocity by drawing a tangent line to the curve at the point of interest and calculating the slope of that tangent line.
Example 2: Estimating Instantaneous Velocity from a Curved Graph
Suppose you have a curved position vs. time graph. To estimate the instantaneous velocity at t = 3 seconds, you would:
- Locate the point on the curve corresponding to t = 3 s.
- Draw a tangent line to the curve at that point. This line should just "kiss" the curve at that point without crossing it.
- Choose two easily identifiable points on the tangent line.
- Calculate the slope of the tangent line using these two points (Δx/Δt). This slope is the estimate of the instantaneous velocity at t = 3 s.
Acceleration and the Slope of a Velocity vs. Time Graph
While the slope of a position vs. time graph gives velocity, the slope of a velocity vs. time graph gives acceleration. This is a crucial connection often missed. If you have a velocity vs. time graph, the slope represents the rate of change of velocity, which is the definition of acceleration.
A positive slope on a velocity vs. time graph means the object is accelerating (speeding up). A negative slope indicates deceleration (slowing down). A zero slope means the object's velocity is constant (no acceleration).
Advanced Concepts and Applications
The concepts discussed above form the foundation for understanding more advanced kinematic concepts. These include:
- Relative Velocity: Understanding how the motion of one object appears relative to another requires careful consideration of slopes in position vs. time graphs.
- Projectile Motion: Analyzing the trajectory of a projectile involves interpreting slopes in both the horizontal and vertical position vs. time graphs.
- Vectors and Multi-Dimensional Motion: For motion in two or three dimensions, we deal with vector quantities, and the slopes of the position vs. time graphs represent the components of the velocity vector.
- Numerical Methods: For complex position functions, numerical techniques can be used to approximate the slope and extract velocity and acceleration information.
Common Mistakes to Avoid
- Confusing Slope with Position: The slope is not the position; it's the rate of change of position (velocity).
- Incorrectly Interpreting Curved Graphs: Always remember that for curved graphs, the slope at a point represents the instantaneous velocity, not the average velocity over the entire curve.
- Ignoring Units: Always include units (e.g., m/s, km/hr) when calculating velocity to maintain clarity and accuracy.
- Misinterpreting Negative Slopes: A negative slope simply means motion in the negative direction; it doesn't necessarily mean the object is slowing down.
Conclusion
Mastering the interpretation of slope in position vs. time graphs is essential for understanding motion. By carefully analyzing the slope – whether positive, negative, zero, or representing instantaneous velocity in curved graphs – we can extract valuable information about an object's velocity and acceleration, forming the cornerstone of kinematic analysis. Practicing with various graph types and scenarios will strengthen your understanding and allow you to confidently tackle a wide range of motion problems. Remember that this fundamental skill opens the door to more advanced concepts in physics and engineering.
Latest Posts
Latest Posts
-
Which Is The Most Reactive Element
Mar 30, 2025
-
Personal Pronouns Have Number Person And What
Mar 30, 2025
-
Is Density And Specific Gravity The Same
Mar 30, 2025
-
Which Complex Carbohydrate Contains Only A 1 4 Glycosidic Linkages
Mar 30, 2025
-
Understanding Media And Culture An Introduction To Mass Communication
Mar 30, 2025
Related Post
Thank you for visiting our website which covers about Slope In Position Vs Time Graph . We hope the information provided has been useful to you. Feel free to contact us if you have any questions or need further assistance. See you next time and don't miss to bookmark.
