T Test For Dependent Samples Formula
Muz Play
Mar 18, 2025 · 6 min read
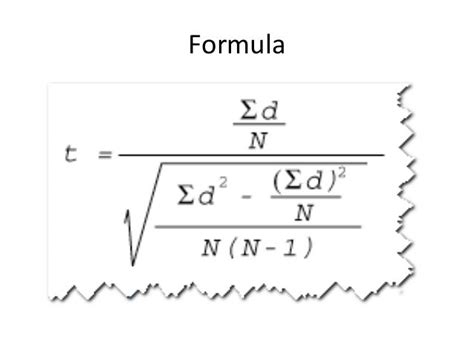
Table of Contents
T-Test for Dependent Samples: A Comprehensive Guide
The t-test for dependent samples, also known as the paired samples t-test or repeated measures t-test, is a statistical procedure used to determine if there's a significant difference between the means of two related groups. Unlike the independent samples t-test, which compares two unrelated groups, the dependent samples t-test analyzes data from the same subjects or matched pairs, measured at two different time points or under two different conditions. This makes it ideal for analyzing pre- and post-test data, assessing the effectiveness of interventions, or comparing paired observations.
This comprehensive guide will delve into the formula, assumptions, interpretation, and practical applications of the dependent samples t-test, providing a complete understanding for researchers and students alike.
Understanding the Logic Behind the Dependent Samples T-Test
The core principle behind the dependent samples t-test lies in analyzing the difference between paired observations. Instead of directly comparing the means of two groups, we calculate the difference scores for each pair and then test whether the mean of these difference scores is significantly different from zero. If the mean difference is significantly different from zero, it suggests a statistically significant effect.
Example: Imagine a researcher studying the effect of a new cognitive training program. They measure participants' cognitive performance before the program (pre-test) and after the program (post-test). The dependent samples t-test would analyze the difference scores (post-test score - pre-test score) to determine if the training program significantly improved cognitive performance.
The Formula for the Dependent Samples T-Test
The formula for calculating the t-statistic in a dependent samples t-test is:
t = (M<sub>d</sub> - μ<sub>d</sub>) / (s<sub>d</sub> / √n)
Where:
- t: The calculated t-statistic. This value will be compared to the critical t-value from the t-distribution to determine statistical significance.
- M<sub>d</sub>: The mean of the difference scores. This is calculated by summing all the difference scores and dividing by the number of pairs.
- μ<sub>d</sub>: The hypothesized mean difference. Typically, this is set to 0, representing the null hypothesis (i.e., there is no significant difference between the two conditions).
- s<sub>d</sub>: The standard deviation of the difference scores. This measures the variability of the difference scores.
- n: The number of pairs of observations.
Calculating the Mean Difference (M<sub>d</sub>)
The mean difference is calculated as follows:
M<sub>d</sub> = Σd / n
Where:
- Σd: The sum of all the difference scores (d).
- n: The number of pairs.
Calculating the Standard Deviation of the Difference Scores (s<sub>d</sub>)
The standard deviation of the difference scores is calculated using the following formula:
s<sub>d</sub> = √[Σ(d - M<sub>d</sub>)² / (n - 1)]
Where:
- d: Individual difference scores.
- M<sub>d</sub>: The mean of the difference scores.
- n: The number of pairs. Note that we divide by (n-1) because we're estimating the population standard deviation from a sample.
Assumptions of the Dependent Samples T-Test
Before conducting a dependent samples t-test, it's crucial to ensure that the data meets several assumptions:
- Normality of the difference scores: The difference scores should be approximately normally distributed. While the t-test is relatively robust to violations of normality, particularly with larger sample sizes, significant departures from normality can affect the results. Visual inspection of a histogram or a Q-Q plot can help assess normality.
- Independence of observations: The difference scores should be independent of each other. This means that the difference score for one pair should not influence the difference score for another pair. This assumption is often met when using different participants for each condition, but is less relevant for repeated measures of the same participants as long as they are truly independent from each other.
- Interval or ratio data: The data should be measured at the interval or ratio level. This means that the differences between values are meaningful and consistent.
Interpreting the Results
After calculating the t-statistic, you'll compare it to the critical t-value from the t-distribution. The critical t-value depends on the chosen significance level (alpha, usually 0.05) and the degrees of freedom (df), which is calculated as:
df = n - 1
- If the absolute value of the calculated t-statistic is greater than the critical t-value: You reject the null hypothesis. This indicates a statistically significant difference between the means of the two related groups.
- If the absolute value of the calculated t-statistic is less than the critical t-value: You fail to reject the null hypothesis. This means that there is not enough evidence to conclude a statistically significant difference between the means.
Effect Size
While statistical significance is important, it's also crucial to assess the effect size. Effect size measures the magnitude of the difference between the two groups, regardless of sample size. A common effect size measure for the dependent samples t-test is Cohen's d:
Cohen's d = M<sub>d</sub> / s<sub>d</sub>
Cohen's d provides a standardized measure of the effect size, allowing for comparison across different studies. Generally:
- d = 0.2: Small effect size
- d = 0.5: Medium effect size
- d = 0.8: Large effect size
Practical Applications
The dependent samples t-test has a wide range of applications in various fields, including:
- Pre- and post-test designs: Evaluating the effectiveness of interventions, treatments, or training programs. For example, assessing the impact of a new teaching method on student performance.
- Matched-pairs designs: Comparing two groups where participants are matched based on relevant characteristics. For example, comparing the effectiveness of two different drugs by matching patients based on age, gender, and disease severity.
- Repeated measures designs: Analyzing data collected from the same subjects at multiple time points. For example, monitoring changes in blood pressure over time in response to a new medication.
- Within-subjects designs: Comparing different conditions within the same participants. For example, comparing reaction times under different levels of distraction.
Alternatives to the Dependent Samples T-Test
While the dependent samples t-test is a powerful tool, there are alternative statistical tests that might be more appropriate depending on the specific research question and data characteristics:
- Wilcoxon signed-rank test: This non-parametric test is used when the assumption of normality is violated. It's a suitable alternative if the difference scores are not normally distributed.
- Repeated measures ANOVA: This test is used when comparing more than two related groups. The dependent samples t-test is only suitable for comparing two related groups.
Conclusion
The dependent samples t-test is a valuable statistical tool for analyzing the difference between the means of two related groups. By understanding the formula, assumptions, interpretation, and practical applications, researchers can effectively utilize this test to draw meaningful conclusions from their data. Remember to always consider the assumptions of the test and explore alternative methods if the assumptions are violated. Moreover, always report both the statistical significance and the effect size to provide a comprehensive understanding of the results. Combining these considerations ensures a rigorous and robust analysis. This detailed guide provides a solid foundation for employing the dependent samples t-test in your research endeavors. Careful consideration of the context, assumptions, and interpretation will lead to more meaningful conclusions and better inform your research's impact.
Latest Posts
Latest Posts
-
Ode To Billy Joe Lyrics Meaning
Mar 18, 2025
-
Where Does The Light Independent Reaction Take Place
Mar 18, 2025
-
S P D F Blocks On The Periodic Table
Mar 18, 2025
-
Delta G Of A Carbonyl Reduction
Mar 18, 2025
-
Difference Between A Strong And Weak Acid
Mar 18, 2025
Related Post
Thank you for visiting our website which covers about T Test For Dependent Samples Formula . We hope the information provided has been useful to you. Feel free to contact us if you have any questions or need further assistance. See you next time and don't miss to bookmark.
