The Supply Curve For A Monopoly Is
Muz Play
Mar 20, 2025 · 6 min read
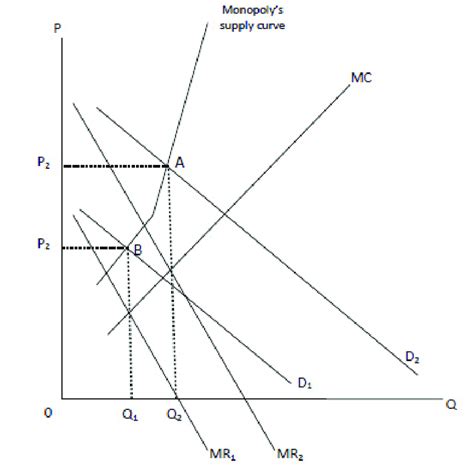
Table of Contents
The Supply Curve for a Monopoly: A Deep Dive
The concept of a supply curve is fundamental to understanding how firms operate in a competitive market. However, this familiar economic tool doesn't directly apply to monopolies. While competitive firms respond to market prices, determining their supply, monopolies set the price. This crucial difference fundamentally alters the way we analyze their behavior and the resulting market outcomes. This article will delve into why a monopoly doesn't have a traditional supply curve, exploring the underlying reasons and examining the implications for market efficiency and consumer welfare.
Why Monopolies Don't Have a Supply Curve
In a perfectly competitive market, the supply curve represents the relationship between the market price and the quantity supplied by all firms. Each firm is a price taker, meaning it accepts the market price as given and decides how much to produce at that price. The market supply curve is the horizontal summation of individual firms' supply curves.
A monopoly, on the other hand, is a single seller that controls the entire market supply. It's a price maker, not a price taker. This means that the monopolist doesn't passively respond to a given market price; instead, it actively chooses both the price and the quantity to maximize its profits.
The key distinction lies in the control over the market: Competitive firms face a perfectly elastic demand curve (horizontal line at the market price), while a monopolist faces the market demand curve, which is downward-sloping. The monopolist must lower the price to sell more units. There's no single quantity supplied at each price; instead, the monopolist chooses the optimal price-quantity combination along the demand curve.
Imagine trying to plot a supply curve for a monopoly. At a given price, the monopolist might choose a certain quantity. But if you were to raise the price, the monopolist might choose a lower quantity, not necessarily a higher one as we see with competitive firms. This behavior violates the fundamental law of supply (that quantity supplied increases with price). This is why economists generally state that a monopoly doesn't have a supply curve.
Monopolist's Profit Maximization: The Crucial Factor
The monopolist's decision-making process revolves around profit maximization. To achieve this, the firm needs to consider both the demand for its product and its cost structure. The monopolist will produce the quantity where marginal revenue (MR) equals marginal cost (MC). This is the fundamental profit maximization condition for any firm, including a monopoly.
However, for a monopolist, marginal revenue is always less than the price (P). This is because to sell an extra unit, the monopolist must lower the price on all units sold, not just the additional unit. Therefore, the marginal revenue curve for a monopolist lies below its demand curve.
This difference between MR and P is a critical factor in understanding the monopolist's behavior and the absence of a supply curve. The monopolist's output decision depends on both the demand curve (which determines the marginal revenue) and the marginal cost curve. Any change in either of these curves will lead to a new price-quantity combination, making a supply curve impossible to define.
Analyzing Monopoly Output and Pricing: A Graphical Approach
Let's illustrate this with a graph. We'll plot the demand curve (D), marginal revenue curve (MR), and marginal cost curve (MC).
- Demand Curve (D): Represents the inverse relationship between price and quantity demanded.
- Marginal Revenue Curve (MR): Lies below the demand curve, reflecting the monopolist's need to lower the price to sell more.
- Marginal Cost Curve (MC): Represents the cost of producing one more unit.
The monopolist's profit-maximizing output (Qm) is determined where the MR curve intersects the MC curve. The monopolist then uses the demand curve to find the price (Pm) corresponding to this quantity.
[Imagine a graph here showing the demand curve (D), marginal revenue curve (MR) downward sloping, and marginal cost curve (MC) upward sloping. The intersection of MR and MC determines the quantity Qm. A vertical line from Qm intersects the demand curve to determine the price Pm.]
This graph illustrates that the monopolist's price and quantity are determined jointly by the demand and cost conditions. There's no single quantity supplied for a given price, negating the possibility of a traditional supply curve.
The Implications of Monopoly Power
The absence of a supply curve for monopolies has profound implications for market efficiency and consumer welfare.
Inefficient Allocation of Resources: Deadweight Loss
Compared to a perfectly competitive market, monopolies typically produce less output (Qm) and charge higher prices (Pm) than would occur under perfect competition. This reduced output creates a deadweight loss, representing the loss of economic efficiency. This loss occurs because some mutually beneficial transactions don't take place due to the monopolist's restriction of output. Consumers who would have been willing to pay more than the marginal cost of production are excluded from the market.
Reduced Consumer Surplus
Consumers also suffer due to the monopolist's actions. The higher price (Pm) reduces consumer surplus, which is the difference between the price consumers are willing to pay and the price they actually pay. This loss of consumer surplus is a direct consequence of the monopolist's exploitation of its market power.
Innovation and Dynamic Efficiency: A Complicated Picture
While static efficiency is often lower under monopoly, the argument for dynamic efficiency suggests potential benefits. Monopolies, protected from competition, may have greater incentives to invest in research and development (R&D), leading to innovation and technological advancements in the long run. However, this is not guaranteed, and the extent of such innovation is heavily debated amongst economists. A monopolist might choose to use its profits to maintain its market dominance rather than invest in R&D.
Regulation of Monopolies: Attempts to Mitigate Negative Impacts
Given the negative consequences of monopolies, governments often intervene through regulation. These regulations aim to curb the monopolist's power and promote greater efficiency. Some common regulatory approaches include:
- Antitrust laws: These laws prohibit anti-competitive practices, such as mergers and price fixing, aimed at preventing the formation or maintenance of monopolies.
- Price controls: Governments may impose price ceilings to prevent monopolists from charging excessively high prices. However, this can lead to shortages if the ceiling is set too low.
- Public ownership: In some cases, the government may choose to nationalize a monopoly, directly controlling production and pricing decisions.
- Incentive regulation: This approach involves setting performance targets for the monopolist, potentially offering rewards for exceeding targets or penalties for failure.
Conclusion: Understanding the Unique Nature of Monopoly
The absence of a supply curve for a monopoly is not merely a technical detail; it's a fundamental aspect that underscores the differences in behavior and market outcomes compared to competitive markets. The monopolist's control over price and quantity leads to inefficiencies, reduced consumer surplus, and potential deadweight losses. While the possibility of increased innovation exists, it's not a guaranteed outcome. Understanding these implications is crucial for evaluating the role of monopolies in the economy and the need for appropriate regulatory interventions to promote a more efficient and equitable market allocation of resources. The dynamic relationship between demand, cost, and the monopolist's profit-maximizing behavior remains central to understanding market power and its consequences. Further research into the complexities of innovation under monopoly conditions will likely continue to refine our understanding of this multifaceted issue.
Latest Posts
Latest Posts
-
Efield Due To A Point Charge
Mar 20, 2025
-
The Longitudinal Growth Of Long Bones Ceases When
Mar 20, 2025
-
Similar Structures That Evolved Independently Are Called
Mar 20, 2025
-
Two Isotopes Of An Element Differ Only In Their
Mar 20, 2025
-
Chemical Potential And Gibbs Free Energy
Mar 20, 2025
Related Post
Thank you for visiting our website which covers about The Supply Curve For A Monopoly Is . We hope the information provided has been useful to you. Feel free to contact us if you have any questions or need further assistance. See you next time and don't miss to bookmark.
