The Symbol For Population Standard Deviation Is
Muz Play
Mar 16, 2025 · 6 min read
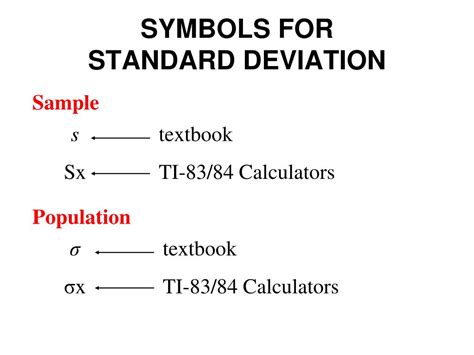
Table of Contents
The Symbol for Population Standard Deviation: A Comprehensive Guide
The symbol for population standard deviation is σ (sigma), a lowercase Greek letter. Understanding what this symbol represents and how it's calculated is crucial in statistics, as it's a fundamental measure of data dispersion. This comprehensive guide delves into the intricacies of population standard deviation, exploring its meaning, calculation, interpretation, and its relationship to other statistical concepts.
Understanding Population Standard Deviation
Standard deviation, in general, measures the spread or dispersion of a dataset. A high standard deviation indicates that the data points are far from the mean (average), while a low standard deviation signifies that the data points cluster closely around the mean. The population standard deviation, specifically, describes the dispersion of an entire population, not just a sample. This distinction is vital because using a sample to estimate the population standard deviation requires different calculations and interpretations.
Key Differences between Sample and Population Standard Deviation:
- Population Standard Deviation (σ): Measures the spread of an entire population. It's calculated using all data points in the population. The symbol is σ.
- Sample Standard Deviation (s): Measures the spread of a sample taken from a larger population. It's calculated using only the data points within the sample. The symbol is usually s or SD. The formula for 's' slightly differs from that of σ to provide an unbiased estimate of the population standard deviation.
The crucial difference lies in the denominator of their respective formulas. We'll explore this further in the following sections.
Calculating Population Standard Deviation: The Formula
The formula for calculating the population standard deviation (σ) is:
σ = √[ Σ(xi - μ)² / N ]
Let's break down this formula step-by-step:
- Σ: This is the summation symbol, meaning "sum of."
- xi: Represents each individual data point in the population.
- μ: Represents the population mean (average). The population mean is calculated by summing all data points and dividing by the total number of data points (N). μ = Σxi / N
- (xi - μ)²: This represents the squared difference between each data point (xi) and the population mean (μ). Squaring the differences ensures that both positive and negative deviations from the mean contribute positively to the overall variance.
- N: Represents the total number of data points in the population.
The formula essentially calculates the average of the squared deviations from the mean. The square root is then taken to return the standard deviation to the original units of the data. This result is the population standard deviation (σ).
Step-by-Step Calculation Example:
Let's consider a small population of five data points: 2, 4, 4, 6, 8.
-
Calculate the population mean (μ): (2 + 4 + 4 + 6 + 8) / 5 = 4.8
-
Calculate the squared differences from the mean:
- (2 - 4.8)² = 7.84
- (4 - 4.8)² = 0.64
- (4 - 4.8)² = 0.64
- (6 - 4.8)² = 1.44
- (8 - 4.8)² = 10.24
-
Sum the squared differences: 7.84 + 0.64 + 0.64 + 1.44 + 10.24 = 20.8
-
Divide by the population size (N): 20.8 / 5 = 4.16 This is the population variance (σ²).
-
Take the square root: √4.16 ≈ 2.04
Therefore, the population standard deviation (σ) for this dataset is approximately 2.04.
Understanding Population Variance (σ²)
Before delving deeper into the implications of σ, let's briefly discuss population variance (σ²). Variance is simply the square of the standard deviation. In the formula above, the quantity before taking the square root (Σ(xi - μ)² / N) is the population variance. While standard deviation is expressed in the same units as the original data, variance is expressed in squared units. While less intuitively interpretable than standard deviation, variance plays a crucial role in many statistical calculations and models.
Interpreting Population Standard Deviation
The value of σ provides valuable insight into the data's dispersion. A larger σ indicates greater variability within the population, meaning the data points are spread out more widely from the mean. Conversely, a smaller σ suggests lower variability, with data points clustered closely around the mean.
For instance, consider two populations of exam scores. One population has a σ of 5, and the other has a σ of 15. The population with σ = 15 exhibits significantly more variability in exam scores than the population with σ = 5. This means there's a broader range of performance levels in the population with higher standard deviation.
Population Standard Deviation and the Normal Distribution
The population standard deviation is particularly important when dealing with normally distributed data. In a normal distribution, approximately 68% of the data falls within one standard deviation of the mean (μ ± σ), 95% falls within two standard deviations (μ ± 2σ), and 99.7% falls within three standard deviations (μ ± 3σ). This "68-95-99.7 rule" (or the empirical rule) is a fundamental concept in statistics and allows for probability estimations based on the population standard deviation and mean.
Using Population Standard Deviation in Real-World Applications
The symbol for population standard deviation, σ, is not just a mathematical symbol; it holds practical significance across diverse fields:
- Finance: σ is used to measure the risk associated with investments. A higher σ indicates greater volatility and risk.
- Manufacturing: σ helps in quality control by measuring the variability in production processes. A smaller σ suggests a more consistent and reliable process.
- Healthcare: σ is used in clinical trials to assess the variability in patient responses to treatments.
- Environmental Science: σ helps to measure variability in environmental factors such as temperature or pollution levels.
- Social Sciences: σ is used to analyze the variability in social phenomena such as income distribution or opinion polls.
Estimating Population Standard Deviation from a Sample
Often, it's impractical or impossible to collect data from an entire population. In such cases, we use sample data to estimate the population standard deviation. As mentioned earlier, the sample standard deviation (s) is calculated using a slightly different formula:
s = √[ Σ(xi - x̄)² / (n - 1) ]
Note the key differences:
- x̄: Represents the sample mean.
- n: Represents the sample size.
- (n - 1): This is the degrees of freedom. Using (n - 1) in the denominator provides an unbiased estimator of the population standard deviation. This correction accounts for the fact that sample data may not perfectly represent the entire population.
Conclusion: The Significance of σ
The symbol for population standard deviation, σ, represents a fundamental concept in statistics. It quantifies the variability within a population and is crucial for understanding data distribution, making predictions, and drawing informed conclusions. Whether analyzing financial markets, assessing manufacturing quality, or understanding social trends, mastering the concept and calculation of population standard deviation is essential for effective data analysis and informed decision-making. Remember that while σ represents the population, the sample standard deviation (s) serves as a valuable, if imperfect, estimator when dealing with sample data, highlighting the importance of understanding both concepts and their subtle but crucial differences. The accurate interpretation and application of σ contribute significantly to a robust understanding of data and its implications.
Latest Posts
Latest Posts
-
Are Strong Bases Good Leaving Groups
Mar 17, 2025
-
Which Polymer Is Composed Of Amino Acids
Mar 17, 2025
-
According To Dalton Atoms Of Different Elements Will Be
Mar 17, 2025
-
Examples Of Essential And Nonessential Nutrients
Mar 17, 2025
-
Electric Potential From A Point Charge
Mar 17, 2025
Related Post
Thank you for visiting our website which covers about The Symbol For Population Standard Deviation Is . We hope the information provided has been useful to you. Feel free to contact us if you have any questions or need further assistance. See you next time and don't miss to bookmark.
