Titration Curve Of Hcl And Naoh
Muz Play
Mar 26, 2025 · 6 min read
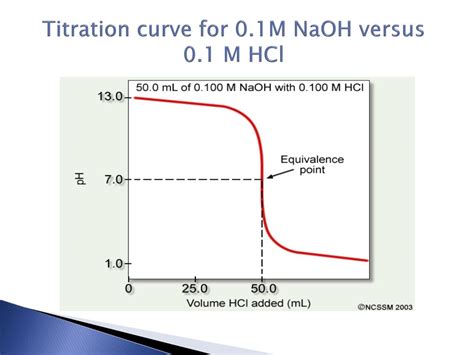
Table of Contents
The Titration Curve of HCl and NaOH: A Comprehensive Guide
The reaction between a strong acid and a strong base is a fundamental concept in chemistry, and understanding its titration curve is crucial for various applications, from analytical chemistry to environmental monitoring. This article delves deep into the titration curve of hydrochloric acid (HCl) and sodium hydroxide (NaOH), explaining its shape, key points, and the underlying chemistry. We'll explore how to calculate pH at different stages of the titration and discuss the practical implications of this classic acid-base titration.
Understanding the Chemistry: HCl and NaOH Reaction
Hydrochloric acid (HCl) is a strong monoprotic acid, meaning it completely dissociates in water to release one hydrogen ion (H⁺) per molecule:
HCl(aq) → H⁺(aq) + Cl⁻(aq)
Sodium hydroxide (NaOH) is a strong monoprotic base, completely dissociating in water to release one hydroxide ion (OH⁻) per molecule:
NaOH(aq) → Na⁺(aq) + OH⁻(aq)
When HCl and NaOH are mixed, a neutralization reaction occurs:
H⁺(aq) + OH⁻(aq) → H₂O(l)
This reaction forms water, a neutral molecule. The stoichiometry is 1:1, meaning one mole of HCl reacts completely with one mole of NaOH.
The Titration Curve: A Visual Representation
A titration curve graphically represents the pH change during a titration. In the HCl-NaOH titration, the x-axis typically represents the volume of NaOH added (in mL), while the y-axis represents the pH of the solution. The curve exhibits a characteristic S-shape.
Key Points on the HCl-NaOH Titration Curve:
-
Initial pH: Before any NaOH is added, the solution contains only HCl. The pH is calculated directly from the initial concentration of HCl using the formula: pH = -log₁₀[HCl]. Since HCl is a strong acid, the concentration of H⁺ ions is equal to the initial HCl concentration.
-
Before the Equivalence Point: As NaOH is added, it reacts with HCl, reducing the concentration of H⁺ ions. The pH gradually increases. Calculations at this stage involve determining the moles of unreacted HCl and dividing by the total volume to find the new H⁺ concentration.
-
The Equivalence Point: This is the point where the moles of added NaOH exactly equal the moles of initial HCl. At this point, all the HCl has been neutralized, and the solution contains only NaCl and water. The pH at the equivalence point for a strong acid-strong base titration is always 7 because the solution is neutral.
-
After the Equivalence Point: Beyond the equivalence point, excess NaOH is present. The pH is determined by the concentration of excess OH⁻ ions. The calculation involves finding the moles of excess NaOH and dividing by the total volume to find the OH⁻ concentration. The pOH is then calculated, and the pH is obtained using the relationship: pH + pOH = 14.
-
The Steepest Part of the Curve: The region around the equivalence point shows a dramatic increase in pH with a small addition of NaOH. This steep rise makes the equivalence point easy to identify experimentally. This is the basis for accurate determination of the concentration of the unknown solution using titration.
Calculating pH at Different Stages
Let's illustrate the pH calculations with a specific example:
Scenario: We titrate 25.00 mL of 0.100 M HCl with 0.100 M NaOH.
1. Initial pH:
[HCl] = 0.100 M pH = -log₁₀(0.100) = 1.00
2. Before the Equivalence Point (e.g., after adding 10.00 mL of NaOH):
- Moles of HCl initially: (0.100 mol/L)(0.02500 L) = 0.00250 mol
- Moles of NaOH added: (0.100 mol/L)(0.01000 L) = 0.00100 mol
- Moles of HCl remaining: 0.00250 mol - 0.00100 mol = 0.00150 mol
- Total volume: 25.00 mL + 10.00 mL = 35.00 mL = 0.03500 L
- [H⁺] = 0.00150 mol / 0.03500 L = 0.0429 M
- pH = -log₁₀(0.0429) ≈ 1.37
3. At the Equivalence Point:
- Volume of NaOH needed to reach equivalence point: (0.00250 mol) / (0.100 mol/L) = 0.02500 L = 25.00 mL
- At the equivalence point, the pH is 7.00 (neutral).
4. After the Equivalence Point (e.g., after adding 30.00 mL of NaOH):
- Moles of NaOH added: (0.100 mol/L)(0.03000 L) = 0.00300 mol
- Moles of NaOH in excess: 0.00300 mol - 0.00250 mol = 0.00050 mol
- Total volume: 25.00 mL + 30.00 mL = 55.00 mL = 0.05500 L
- [OH⁻] = 0.00050 mol / 0.05500 L = 0.00909 M
- pOH = -log₁₀(0.00909) ≈ 2.04
- pH = 14.00 - 2.04 ≈ 11.96
These calculations demonstrate how the pH changes throughout the titration. More detailed calculations, especially for points closer to the equivalence point, may require consideration of the autoionization of water.
Practical Applications and Significance
The HCl-NaOH titration curve and the principles behind it have numerous practical applications:
-
Acid-Base Titration: This is a fundamental technique in analytical chemistry used to determine the concentration of an unknown acid or base solution. By titrating the unknown solution with a solution of known concentration (a standard solution), and observing the change in pH, the concentration of the unknown can be accurately determined.
-
Environmental Monitoring: Monitoring the pH of water samples is essential in various environmental applications. The principles of acid-base titration help in determining the acidity or alkalinity of water bodies. This information is critical in assessing water quality and its suitability for different purposes.
-
Industrial Processes: Many industrial processes involve acid-base reactions. Understanding titration curves allows for the precise control of pH in these processes, ensuring optimal efficiency and product quality.
-
Pharmaceutical Industry: pH control is essential in the pharmaceutical industry during drug formulation and manufacturing. Titration is a vital tool to ensure the stability and efficacy of pharmaceutical products.
Factors Affecting the Titration Curve
Several factors can influence the shape and position of the titration curve:
-
Concentration of the acid and base: Higher concentrations result in a steeper curve around the equivalence point.
-
Temperature: Temperature affects the ionization constant of water (Kw), slightly influencing the pH at the equivalence point.
-
Presence of other ions: The presence of other ions in the solution can affect the activity coefficients of the ions, leading to slight deviations from the ideal titration curve.
Conclusion
The titration curve of HCl and NaOH is a classic example of a strong acid-strong base titration. Understanding its shape, key points, and the underlying chemistry provides a solid foundation for various applications in chemistry and related fields. The ability to calculate pH at different stages of the titration is crucial for accurate analysis and precise control in numerous contexts, ranging from laboratory experiments to industrial processes. This comprehensive overview provides a detailed understanding of this fundamental chemical concept and its far-reaching implications. The precise determination of equivalence points and the subsequent calculations are critical for accurate quantitative analysis, a cornerstone of modern chemistry and its practical applications.
Latest Posts
Latest Posts
-
Use The Cofactor Expansion To Compute The Following Determinant
Mar 29, 2025
-
How To Find Point Of Tangency
Mar 29, 2025
-
How Do You Calculate Potential Difference
Mar 29, 2025
-
How To Round To Four Decimal Places
Mar 29, 2025
-
Reaction Of Benzoic Acid And Naoh
Mar 29, 2025
Related Post
Thank you for visiting our website which covers about Titration Curve Of Hcl And Naoh . We hope the information provided has been useful to you. Feel free to contact us if you have any questions or need further assistance. See you next time and don't miss to bookmark.
